Asian vs Immigrants from Bolivia Average Family Size
COMPARE
Asian
Immigrants from Bolivia
Average Family Size
Average Family Size Comparison
Asians
Immigrants from Bolivia
3.28
AVERAGE FAMILY SIZE
97.0/ 100
METRIC RATING
108th/ 347
METRIC RANK
3.31
AVERAGE FAMILY SIZE
99.6/ 100
METRIC RATING
88th/ 347
METRIC RANK
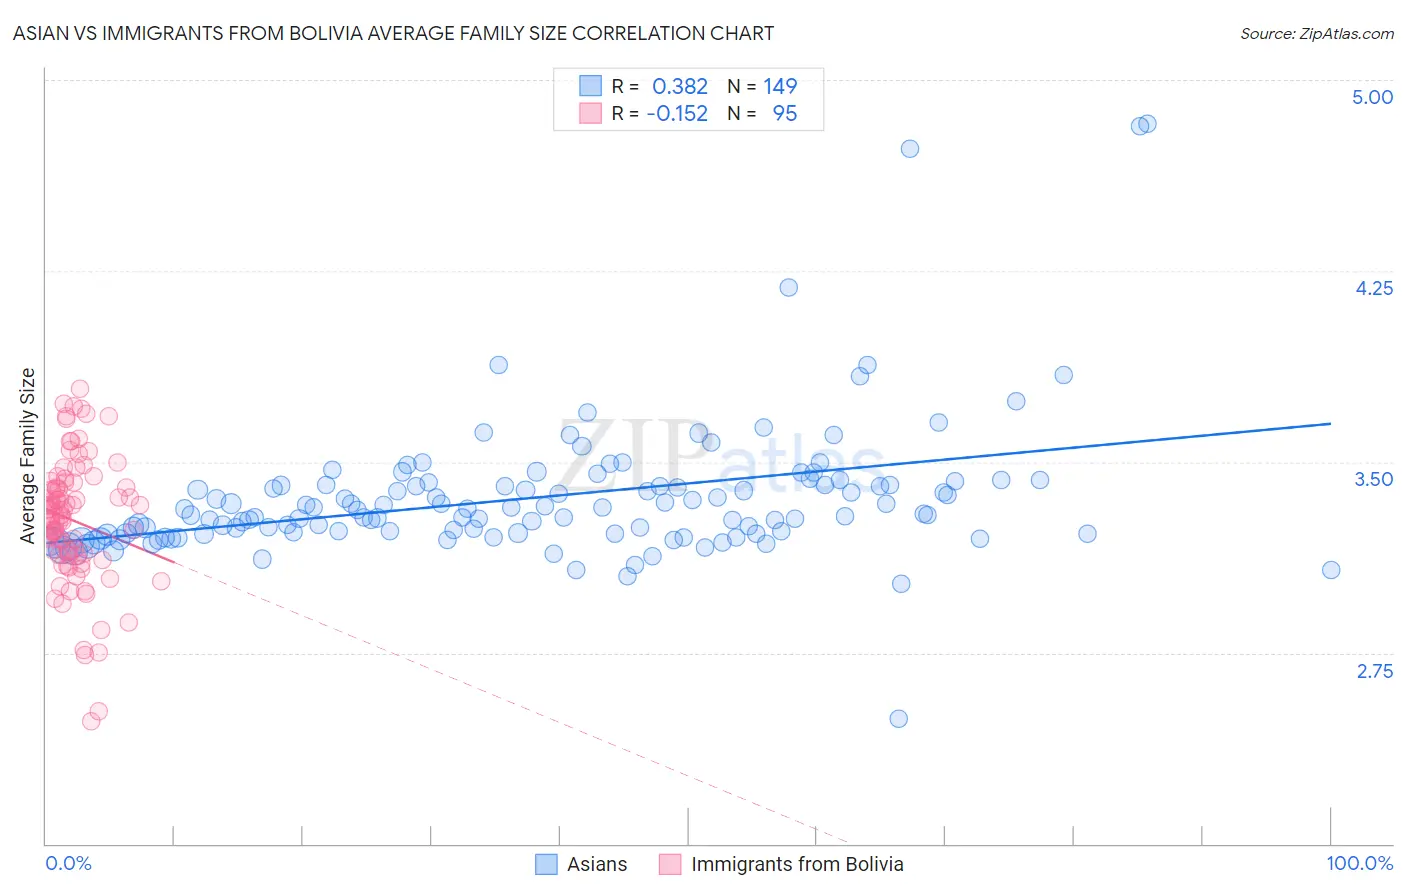
Asian vs Immigrants from Bolivia Average Family Size Correlation Chart
The statistical analysis conducted on geographies consisting of 550,276,213 people shows a mild positive correlation between the proportion of Asians and average family size in the United States with a correlation coefficient (R) of 0.382 and weighted average of 3.28. Similarly, the statistical analysis conducted on geographies consisting of 158,712,617 people shows a poor negative correlation between the proportion of Immigrants from Bolivia and average family size in the United States with a correlation coefficient (R) of -0.152 and weighted average of 3.31, a difference of 0.88%.
Average Family Size Correlation Summary
| Measurement | Asian | Immigrants from Bolivia |
| Minimum | 2.49 | 2.48 |
| Maximum | 4.83 | 3.79 |
| Range | 2.34 | 1.31 |
| Mean | 3.36 | 3.27 |
| Median | 3.29 | 3.29 |
| Interquartile 25% (IQ1) | 3.22 | 3.13 |
| Interquartile 75% (IQ3) | 3.41 | 3.42 |
| Interquartile Range (IQR) | 0.19 | 0.28 |
| Standard Deviation (Sample) | 0.28 | 0.25 |
| Standard Deviation (Population) | 0.28 | 0.25 |
Demographics Similar to Asians and Immigrants from Bolivia by Average Family Size
In terms of average family size, the demographic groups most similar to Asians are Ghanaian (3.29, a difference of 0.17%), Paiute (3.29, a difference of 0.19%), Immigrants from Ghana (3.29, a difference of 0.21%), Bolivian (3.29, a difference of 0.26%), and Immigrants from Western Africa (3.29, a difference of 0.30%). Similarly, the demographic groups most similar to Immigrants from Bolivia are Malaysian (3.31, a difference of 0.010%), Menominee (3.30, a difference of 0.12%), Immigrants from Pakistan (3.30, a difference of 0.27%), Immigrants from Cameroon (3.30, a difference of 0.28%), and Peruvian (3.30, a difference of 0.29%).
| Demographics | Rating | Rank | Average Family Size |
| Immigrants | Bolivia | 99.6 /100 | #88 | Exceptional 3.31 |
| Malaysians | 99.6 /100 | #89 | Exceptional 3.31 |
| Menominee | 99.4 /100 | #90 | Exceptional 3.30 |
| Immigrants | Pakistan | 99.2 /100 | #91 | Exceptional 3.30 |
| Immigrants | Cameroon | 99.2 /100 | #92 | Exceptional 3.30 |
| Peruvians | 99.2 /100 | #93 | Exceptional 3.30 |
| Sierra Leoneans | 99.0 /100 | #94 | Exceptional 3.30 |
| Immigrants | Lebanon | 99.0 /100 | #95 | Exceptional 3.30 |
| U.S. Virgin Islanders | 98.8 /100 | #96 | Exceptional 3.29 |
| Immigrants | Oceania | 98.7 /100 | #97 | Exceptional 3.29 |
| Barbadians | 98.6 /100 | #98 | Exceptional 3.29 |
| Nigerians | 98.6 /100 | #99 | Exceptional 3.29 |
| Guamanians/Chamorros | 98.6 /100 | #100 | Exceptional 3.29 |
| Immigrants | Burma/Myanmar | 98.6 /100 | #101 | Exceptional 3.29 |
| West Indians | 98.5 /100 | #102 | Exceptional 3.29 |
| Immigrants | Western Africa | 98.4 /100 | #103 | Exceptional 3.29 |
| Bolivians | 98.3 /100 | #104 | Exceptional 3.29 |
| Immigrants | Ghana | 98.1 /100 | #105 | Exceptional 3.29 |
| Paiute | 98.0 /100 | #106 | Exceptional 3.29 |
| Ghanaians | 98.0 /100 | #107 | Exceptional 3.29 |
| Asians | 97.0 /100 | #108 | Exceptional 3.28 |