Immigrants from Nepal vs Ghanaian Family Households with Children
COMPARE
Immigrants from Nepal
Ghanaian
Family Households with Children
Family Households with Children Comparison
Immigrants from Nepal
Ghanaians
28.4%
FAMILY HOUSEHOLDS WITH CHILDREN
99.8/ 100
METRIC RATING
78th/ 347
METRIC RANK
28.5%
FAMILY HOUSEHOLDS WITH CHILDREN
99.9/ 100
METRIC RATING
67th/ 347
METRIC RANK
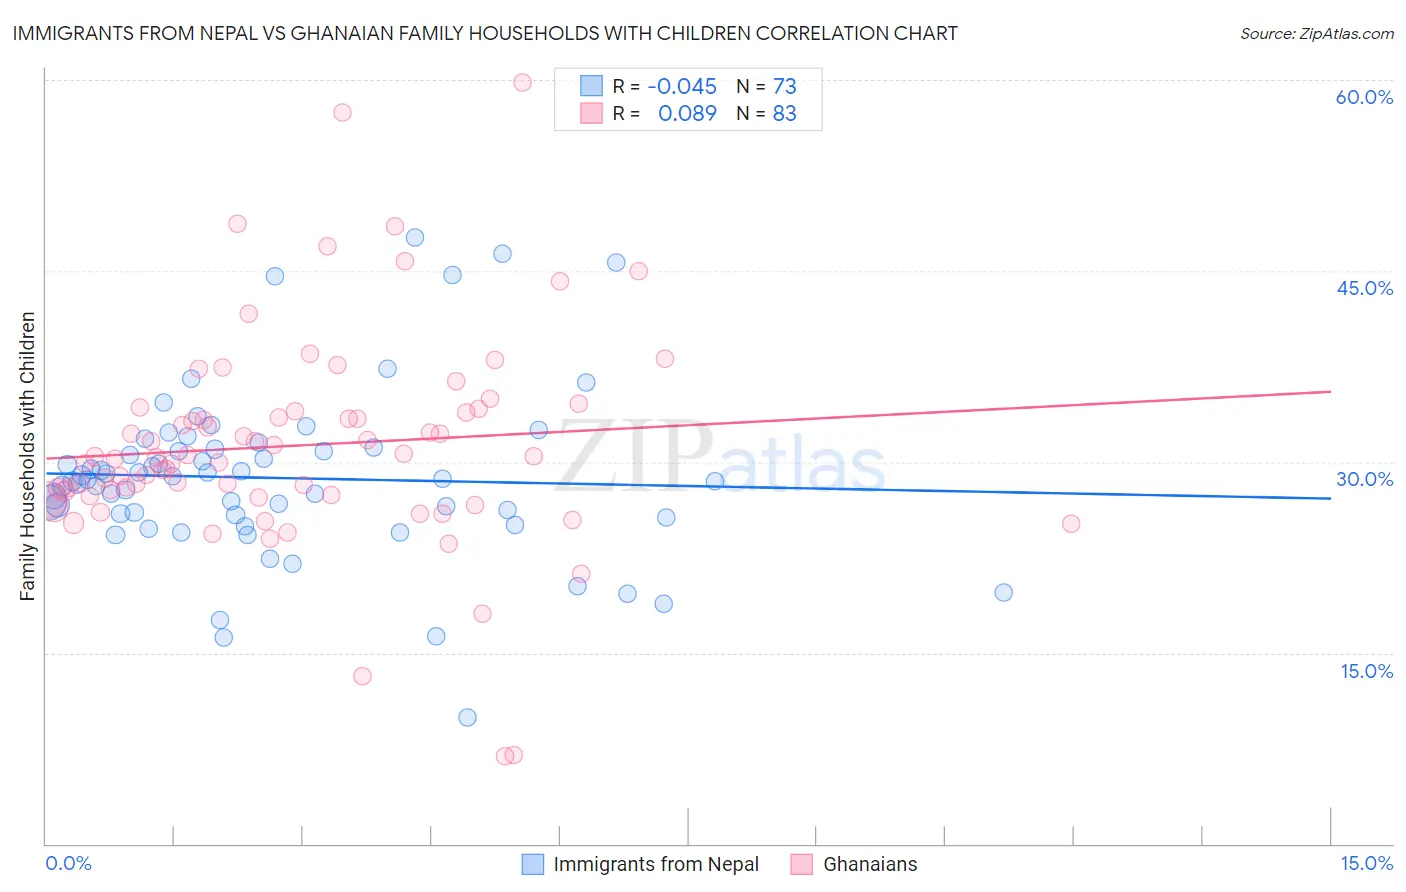
Immigrants from Nepal vs Ghanaian Family Households with Children Correlation Chart
The statistical analysis conducted on geographies consisting of 186,675,675 people shows no correlation between the proportion of Immigrants from Nepal and percentage of family households with children in the United States with a correlation coefficient (R) of -0.045 and weighted average of 28.4%. Similarly, the statistical analysis conducted on geographies consisting of 190,475,172 people shows a slight positive correlation between the proportion of Ghanaians and percentage of family households with children in the United States with a correlation coefficient (R) of 0.089 and weighted average of 28.5%, a difference of 0.39%.
Family Households with Children Correlation Summary
| Measurement | Immigrants from Nepal | Ghanaian |
| Minimum | 9.9% | 6.8% |
| Maximum | 47.7% | 59.8% |
| Range | 37.7% | 53.0% |
| Mean | 28.7% | 31.3% |
| Median | 28.6% | 30.4% |
| Interquartile 25% (IQ1) | 25.7% | 27.3% |
| Interquartile 75% (IQ3) | 31.1% | 34.0% |
| Interquartile Range (IQR) | 5.3% | 6.7% |
| Standard Deviation (Sample) | 6.7% | 8.4% |
| Standard Deviation (Population) | 6.6% | 8.4% |
Demographics Similar to Immigrants from Nepal and Ghanaians by Family Households with Children
In terms of family households with children, the demographic groups most similar to Immigrants from Nepal are Immigrants from Iraq (28.4%, a difference of 0.030%), Nigerian (28.4%, a difference of 0.040%), Native/Alaskan (28.4%, a difference of 0.040%), South American (28.4%, a difference of 0.060%), and Immigrants from Sri Lanka (28.4%, a difference of 0.090%). Similarly, the demographic groups most similar to Ghanaians are Immigrants from Egypt (28.5%, a difference of 0.0%), Honduran (28.5%, a difference of 0.010%), Houma (28.5%, a difference of 0.020%), Immigrants from Korea (28.5%, a difference of 0.040%), and Filipino (28.6%, a difference of 0.090%).
| Demographics | Rating | Rank | Family Households with Children |
| Egyptians | 99.9 /100 | #62 | Exceptional 28.6% |
| Immigrants | Lebanon | 99.9 /100 | #63 | Exceptional 28.6% |
| Filipinos | 99.9 /100 | #64 | Exceptional 28.6% |
| Hondurans | 99.9 /100 | #65 | Exceptional 28.5% |
| Immigrants | Egypt | 99.9 /100 | #66 | Exceptional 28.5% |
| Ghanaians | 99.9 /100 | #67 | Exceptional 28.5% |
| Houma | 99.9 /100 | #68 | Exceptional 28.5% |
| Immigrants | Korea | 99.9 /100 | #69 | Exceptional 28.5% |
| Immigrants | Honduras | 99.9 /100 | #70 | Exceptional 28.5% |
| Burmese | 99.9 /100 | #71 | Exceptional 28.5% |
| Immigrants | Indonesia | 99.9 /100 | #72 | Exceptional 28.5% |
| Iraqis | 99.9 /100 | #73 | Exceptional 28.5% |
| Laotians | 99.9 /100 | #74 | Exceptional 28.5% |
| Immigrants | Jordan | 99.9 /100 | #75 | Exceptional 28.4% |
| Immigrants | Sri Lanka | 99.9 /100 | #76 | Exceptional 28.4% |
| Nigerians | 99.8 /100 | #77 | Exceptional 28.4% |
| Immigrants | Nepal | 99.8 /100 | #78 | Exceptional 28.4% |
| Immigrants | Iraq | 99.8 /100 | #79 | Exceptional 28.4% |
| Natives/Alaskans | 99.8 /100 | #80 | Exceptional 28.4% |
| South Americans | 99.8 /100 | #81 | Exceptional 28.4% |
| Kenyans | 99.8 /100 | #82 | Exceptional 28.4% |