Immigrants from Liberia vs Ghanaian Family Households with Children
COMPARE
Immigrants from Liberia
Ghanaian
Family Households with Children
Family Households with Children Comparison
Immigrants from Liberia
Ghanaians
28.2%
FAMILY HOUSEHOLDS WITH CHILDREN
99.4/ 100
METRIC RATING
91st/ 347
METRIC RANK
28.5%
FAMILY HOUSEHOLDS WITH CHILDREN
99.9/ 100
METRIC RATING
67th/ 347
METRIC RANK
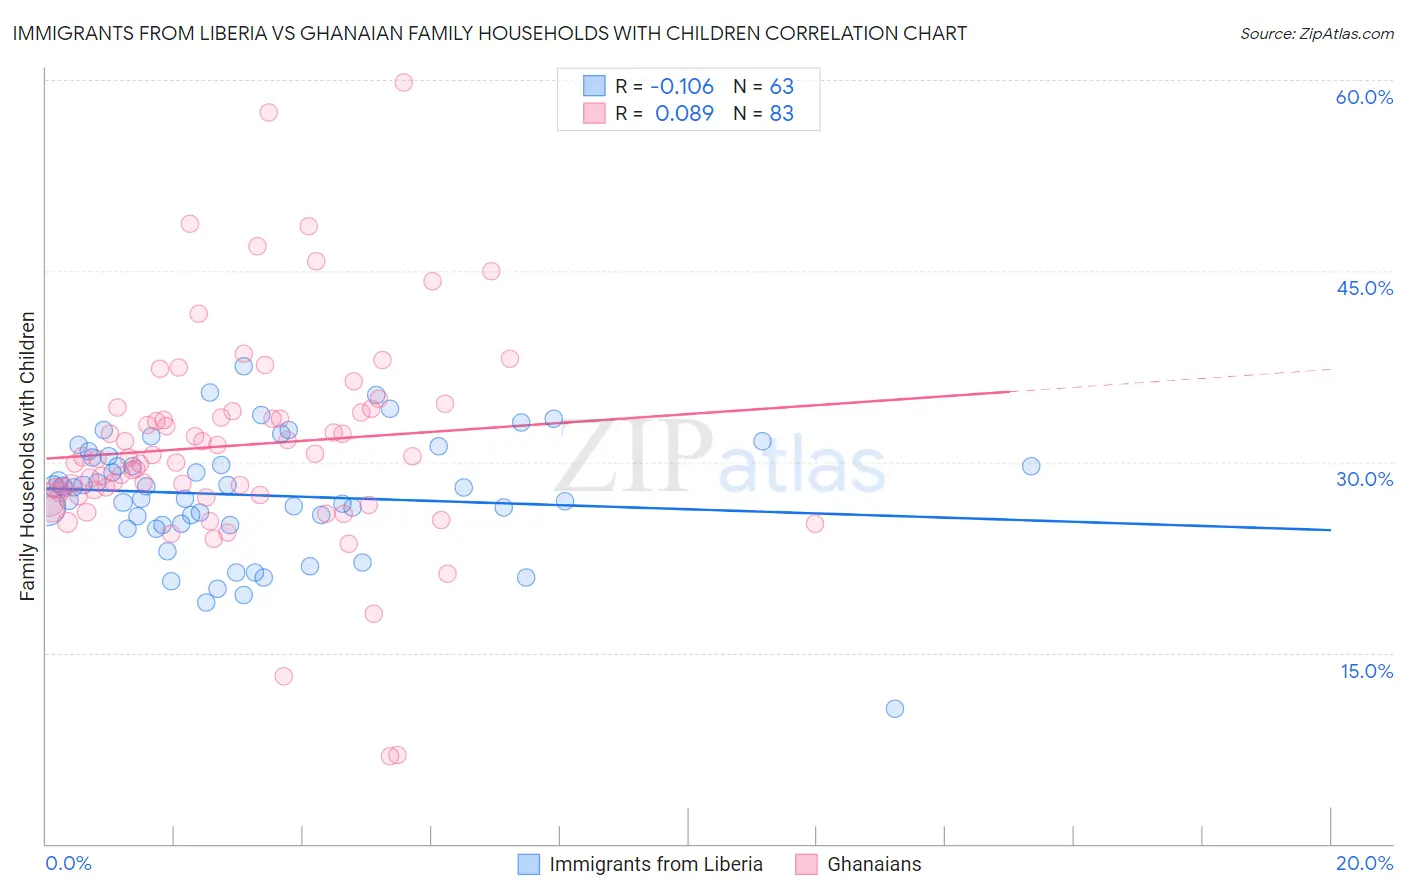
Immigrants from Liberia vs Ghanaian Family Households with Children Correlation Chart
The statistical analysis conducted on geographies consisting of 135,222,977 people shows a poor negative correlation between the proportion of Immigrants from Liberia and percentage of family households with children in the United States with a correlation coefficient (R) of -0.106 and weighted average of 28.2%. Similarly, the statistical analysis conducted on geographies consisting of 190,475,172 people shows a slight positive correlation between the proportion of Ghanaians and percentage of family households with children in the United States with a correlation coefficient (R) of 0.089 and weighted average of 28.5%, a difference of 1.1%.
Family Households with Children Correlation Summary
| Measurement | Immigrants from Liberia | Ghanaian |
| Minimum | 10.6% | 6.8% |
| Maximum | 37.5% | 59.8% |
| Range | 26.9% | 53.0% |
| Mean | 27.4% | 31.3% |
| Median | 28.0% | 30.4% |
| Interquartile 25% (IQ1) | 25.1% | 27.3% |
| Interquartile 75% (IQ3) | 30.4% | 34.0% |
| Interquartile Range (IQR) | 5.4% | 6.7% |
| Standard Deviation (Sample) | 4.7% | 8.4% |
| Standard Deviation (Population) | 4.7% | 8.4% |
Similar Demographics by Family Households with Children
Demographics Similar to Immigrants from Liberia by Family Households with Children
In terms of family households with children, the demographic groups most similar to Immigrants from Liberia are Chickasaw (28.2%, a difference of 0.020%), Immigrants from Thailand (28.2%, a difference of 0.050%), Panamanian (28.2%, a difference of 0.13%), Liberian (28.3%, a difference of 0.16%), and Immigrants from Costa Rica (28.3%, a difference of 0.16%).
| Demographics | Rating | Rank | Family Households with Children |
| Costa Ricans | 99.8 /100 | #84 | Exceptional 28.4% |
| Immigrants | Syria | 99.8 /100 | #85 | Exceptional 28.4% |
| Immigrants | Western Africa | 99.6 /100 | #86 | Exceptional 28.3% |
| Colombians | 99.6 /100 | #87 | Exceptional 28.3% |
| Liberians | 99.6 /100 | #88 | Exceptional 28.3% |
| Immigrants | Costa Rica | 99.6 /100 | #89 | Exceptional 28.3% |
| Immigrants | Thailand | 99.5 /100 | #90 | Exceptional 28.2% |
| Immigrants | Liberia | 99.4 /100 | #91 | Exceptional 28.2% |
| Chickasaw | 99.4 /100 | #92 | Exceptional 28.2% |
| Panamanians | 99.3 /100 | #93 | Exceptional 28.2% |
| Immigrants | Colombia | 99.2 /100 | #94 | Exceptional 28.2% |
| Immigrants | Nicaragua | 99.1 /100 | #95 | Exceptional 28.2% |
| Ute | 99.1 /100 | #96 | Exceptional 28.2% |
| Chileans | 98.9 /100 | #97 | Exceptional 28.1% |
| Immigrants | Kenya | 98.9 /100 | #98 | Exceptional 28.1% |
Demographics Similar to Ghanaians by Family Households with Children
In terms of family households with children, the demographic groups most similar to Ghanaians are Immigrants from Egypt (28.5%, a difference of 0.0%), Honduran (28.5%, a difference of 0.010%), Houma (28.5%, a difference of 0.020%), Immigrants from Korea (28.5%, a difference of 0.040%), and Filipino (28.6%, a difference of 0.090%).
| Demographics | Rating | Rank | Family Households with Children |
| Hmong | 99.9 /100 | #60 | Exceptional 28.6% |
| Immigrants | Ghana | 99.9 /100 | #61 | Exceptional 28.6% |
| Egyptians | 99.9 /100 | #62 | Exceptional 28.6% |
| Immigrants | Lebanon | 99.9 /100 | #63 | Exceptional 28.6% |
| Filipinos | 99.9 /100 | #64 | Exceptional 28.6% |
| Hondurans | 99.9 /100 | #65 | Exceptional 28.5% |
| Immigrants | Egypt | 99.9 /100 | #66 | Exceptional 28.5% |
| Ghanaians | 99.9 /100 | #67 | Exceptional 28.5% |
| Houma | 99.9 /100 | #68 | Exceptional 28.5% |
| Immigrants | Korea | 99.9 /100 | #69 | Exceptional 28.5% |
| Immigrants | Honduras | 99.9 /100 | #70 | Exceptional 28.5% |
| Burmese | 99.9 /100 | #71 | Exceptional 28.5% |
| Immigrants | Indonesia | 99.9 /100 | #72 | Exceptional 28.5% |
| Iraqis | 99.9 /100 | #73 | Exceptional 28.5% |
| Laotians | 99.9 /100 | #74 | Exceptional 28.5% |