Immigrants from Morocco vs Palestinian Family Households with Children
COMPARE
Immigrants from Morocco
Palestinian
Family Households with Children
Family Households with Children Comparison
Immigrants from Morocco
Palestinians
27.0%
FAMILY HOUSEHOLDS WITH CHILDREN
4.2/ 100
METRIC RATING
235th/ 347
METRIC RANK
28.1%
FAMILY HOUSEHOLDS WITH CHILDREN
98.5/ 100
METRIC RATING
103rd/ 347
METRIC RANK
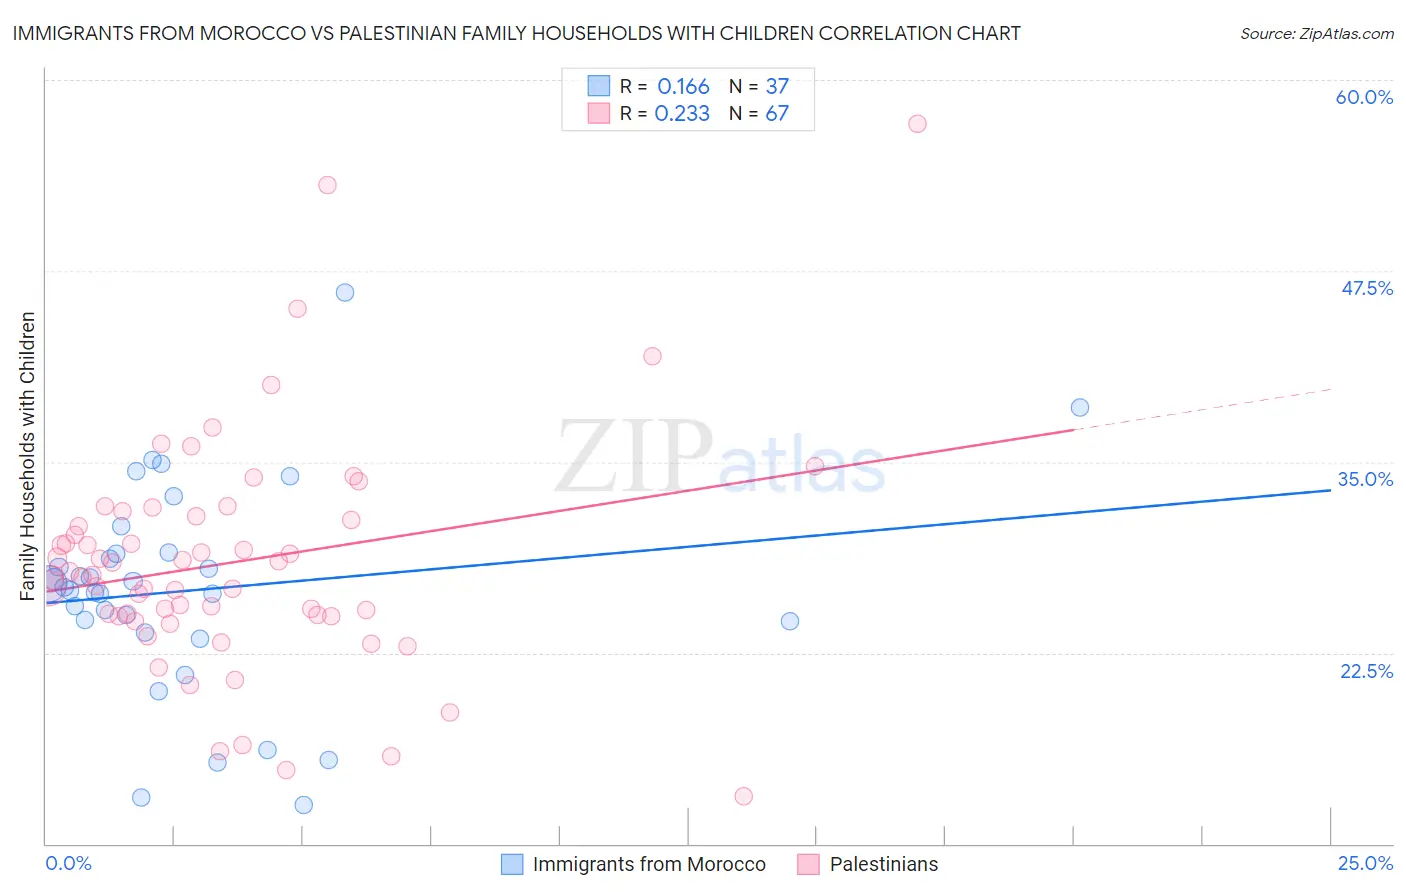
Immigrants from Morocco vs Palestinian Family Households with Children Correlation Chart
The statistical analysis conducted on geographies consisting of 178,874,174 people shows a poor positive correlation between the proportion of Immigrants from Morocco and percentage of family households with children in the United States with a correlation coefficient (R) of 0.166 and weighted average of 27.0%. Similarly, the statistical analysis conducted on geographies consisting of 216,372,515 people shows a weak positive correlation between the proportion of Palestinians and percentage of family households with children in the United States with a correlation coefficient (R) of 0.233 and weighted average of 28.1%, a difference of 4.1%.
Family Households with Children Correlation Summary
| Measurement | Immigrants from Morocco | Palestinian |
| Minimum | 12.6% | 13.1% |
| Maximum | 46.1% | 57.1% |
| Range | 33.5% | 44.1% |
| Mean | 26.6% | 28.4% |
| Median | 26.8% | 27.6% |
| Interquartile 25% (IQ1) | 24.2% | 24.9% |
| Interquartile 75% (IQ3) | 29.1% | 31.4% |
| Interquartile Range (IQR) | 4.9% | 6.5% |
| Standard Deviation (Sample) | 6.9% | 7.6% |
| Standard Deviation (Population) | 6.8% | 7.6% |
Similar Demographics by Family Households with Children
Demographics Similar to Immigrants from Morocco by Family Households with Children
In terms of family households with children, the demographic groups most similar to Immigrants from Morocco are Immigrants from Germany (27.0%, a difference of 0.040%), Cape Verdean (26.9%, a difference of 0.090%), Immigrants from Italy (27.0%, a difference of 0.11%), Immigrants from Netherlands (26.9%, a difference of 0.11%), and Yugoslavian (27.0%, a difference of 0.12%).
| Demographics | Rating | Rank | Family Households with Children |
| Scottish | 6.5 /100 | #228 | Tragic 27.0% |
| Immigrants | Caribbean | 6.3 /100 | #229 | Tragic 27.0% |
| Bulgarians | 5.8 /100 | #230 | Tragic 27.0% |
| Luxembourgers | 5.5 /100 | #231 | Tragic 27.0% |
| Yugoslavians | 5.1 /100 | #232 | Tragic 27.0% |
| Immigrants | Italy | 5.0 /100 | #233 | Tragic 27.0% |
| Immigrants | Germany | 4.4 /100 | #234 | Tragic 27.0% |
| Immigrants | Morocco | 4.2 /100 | #235 | Tragic 27.0% |
| Cape Verdeans | 3.6 /100 | #236 | Tragic 26.9% |
| Immigrants | Netherlands | 3.5 /100 | #237 | Tragic 26.9% |
| Moroccans | 3.4 /100 | #238 | Tragic 26.9% |
| Immigrants | Southern Europe | 3.4 /100 | #239 | Tragic 26.9% |
| Immigrants | Bulgaria | 3.3 /100 | #240 | Tragic 26.9% |
| Navajo | 3.2 /100 | #241 | Tragic 26.9% |
| Immigrants | England | 3.2 /100 | #242 | Tragic 26.9% |
Demographics Similar to Palestinians by Family Households with Children
In terms of family households with children, the demographic groups most similar to Palestinians are Sioux (28.1%, a difference of 0.050%), Choctaw (28.1%, a difference of 0.050%), Assyrian/Chaldean/Syriac (28.1%, a difference of 0.10%), Immigrants from Oceania (28.1%, a difference of 0.13%), and Immigrants from the Azores (28.1%, a difference of 0.15%).
| Demographics | Rating | Rank | Family Households with Children |
| Ute | 99.1 /100 | #96 | Exceptional 28.2% |
| Chileans | 98.9 /100 | #97 | Exceptional 28.1% |
| Immigrants | Kenya | 98.9 /100 | #98 | Exceptional 28.1% |
| Immigrants | Azores | 98.8 /100 | #99 | Exceptional 28.1% |
| Indonesians | 98.8 /100 | #100 | Exceptional 28.1% |
| Immigrants | Oceania | 98.8 /100 | #101 | Exceptional 28.1% |
| Assyrians/Chaldeans/Syriacs | 98.7 /100 | #102 | Exceptional 28.1% |
| Palestinians | 98.5 /100 | #103 | Exceptional 28.1% |
| Sioux | 98.3 /100 | #104 | Exceptional 28.1% |
| Choctaw | 98.3 /100 | #105 | Exceptional 28.1% |
| Immigrants | South America | 98.0 /100 | #106 | Exceptional 28.0% |
| Immigrants | Uganda | 97.7 /100 | #107 | Exceptional 28.0% |
| Immigrants | Burma/Myanmar | 97.7 /100 | #108 | Exceptional 28.0% |
| Tohono O'odham | 97.6 /100 | #109 | Exceptional 28.0% |
| Spaniards | 97.4 /100 | #110 | Exceptional 28.0% |