Immigrants from Morocco vs Immigrants from Egypt Family Households
COMPARE
Immigrants from Morocco
Immigrants from Egypt
Family Households
Family Households Comparison
Immigrants from Morocco
Immigrants from Egypt
62.0%
FAMILY HOUSEHOLDS
0.0/ 100
METRIC RATING
311th/ 347
METRIC RANK
65.3%
FAMILY HOUSEHOLDS
99.2/ 100
METRIC RATING
87th/ 347
METRIC RANK
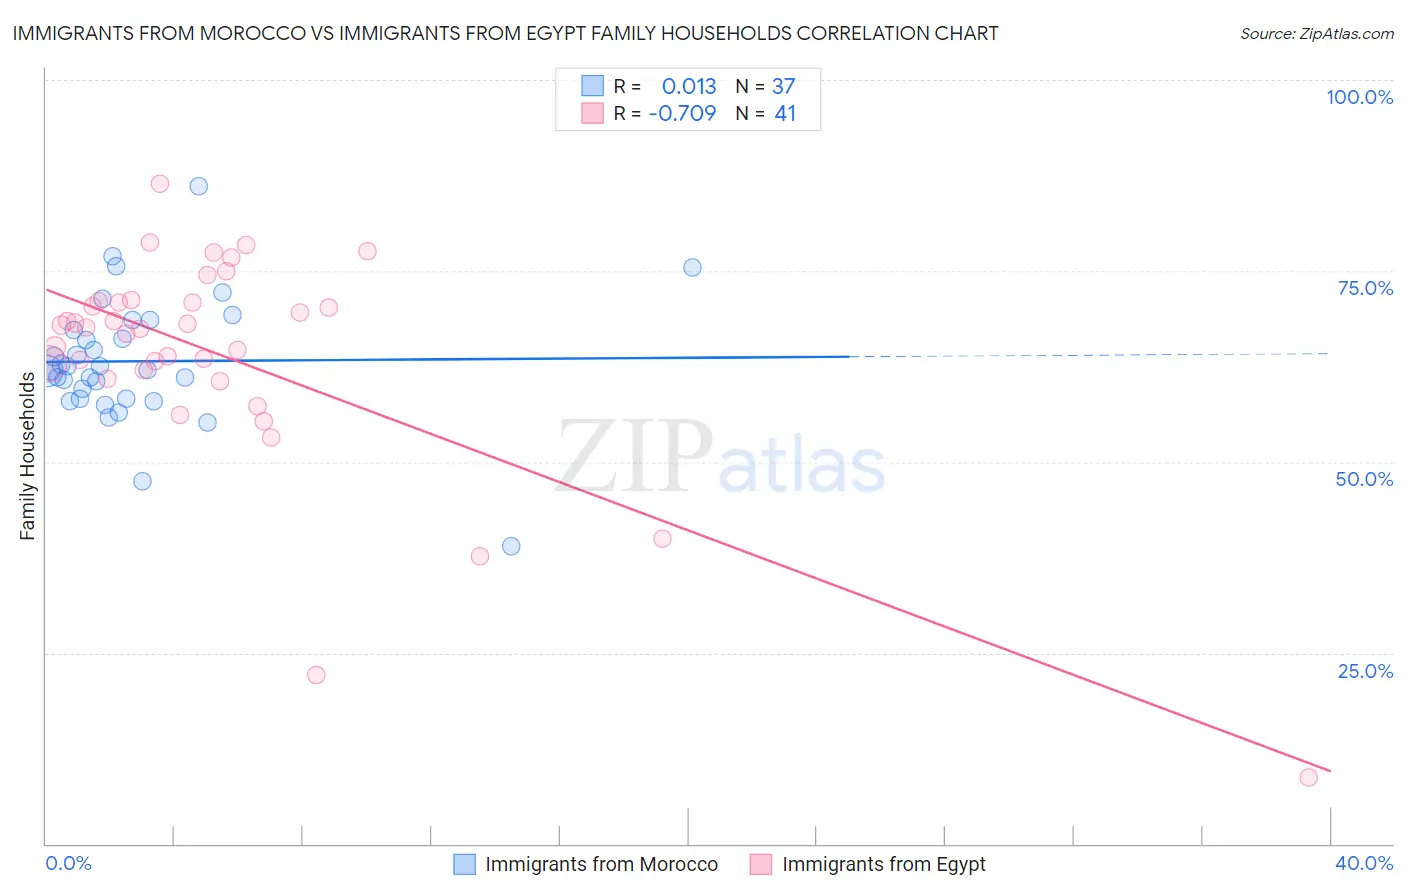
Immigrants from Morocco vs Immigrants from Egypt Family Households Correlation Chart
The statistical analysis conducted on geographies consisting of 178,909,930 people shows no correlation between the proportion of Immigrants from Morocco and percentage of family households in the United States with a correlation coefficient (R) of 0.013 and weighted average of 62.0%. Similarly, the statistical analysis conducted on geographies consisting of 245,430,680 people shows a strong negative correlation between the proportion of Immigrants from Egypt and percentage of family households in the United States with a correlation coefficient (R) of -0.709 and weighted average of 65.3%, a difference of 5.4%.
Family Households Correlation Summary
| Measurement | Immigrants from Morocco | Immigrants from Egypt |
| Minimum | 38.9% | 8.7% |
| Maximum | 86.0% | 86.5% |
| Range | 47.1% | 77.8% |
| Mean | 63.2% | 64.0% |
| Median | 62.0% | 67.6% |
| Interquartile 25% (IQ1) | 58.2% | 61.5% |
| Interquartile 75% (IQ3) | 67.9% | 71.0% |
| Interquartile Range (IQR) | 9.6% | 9.5% |
| Standard Deviation (Sample) | 8.3% | 14.6% |
| Standard Deviation (Population) | 8.2% | 14.4% |
Similar Demographics by Family Households
Demographics Similar to Immigrants from Morocco by Family Households
In terms of family households, the demographic groups most similar to Immigrants from Morocco are Immigrants from Liberia (62.0%, a difference of 0.030%), Immigrants from Latvia (62.0%, a difference of 0.050%), Liberian (62.0%, a difference of 0.050%), Subsaharan African (62.1%, a difference of 0.070%), and Immigrants from Cabo Verde (61.9%, a difference of 0.10%).
| Demographics | Rating | Rank | Family Households |
| Iroquois | 0.0 /100 | #304 | Tragic 62.2% |
| Bermudans | 0.0 /100 | #305 | Tragic 62.2% |
| Africans | 0.0 /100 | #306 | Tragic 62.1% |
| Immigrants | Norway | 0.0 /100 | #307 | Tragic 62.1% |
| Chippewa | 0.0 /100 | #308 | Tragic 62.1% |
| Sub-Saharan Africans | 0.0 /100 | #309 | Tragic 62.1% |
| Immigrants | Liberia | 0.0 /100 | #310 | Tragic 62.0% |
| Immigrants | Morocco | 0.0 /100 | #311 | Tragic 62.0% |
| Immigrants | Latvia | 0.0 /100 | #312 | Tragic 62.0% |
| Liberians | 0.0 /100 | #313 | Tragic 62.0% |
| Immigrants | Cabo Verde | 0.0 /100 | #314 | Tragic 61.9% |
| Moroccans | 0.0 /100 | #315 | Tragic 61.9% |
| Immigrants | Middle Africa | 0.0 /100 | #316 | Tragic 61.9% |
| Immigrants | Bosnia and Herzegovina | 0.0 /100 | #317 | Tragic 61.9% |
| Alaskan Athabascans | 0.0 /100 | #318 | Tragic 61.8% |
Demographics Similar to Immigrants from Egypt by Family Households
In terms of family households, the demographic groups most similar to Immigrants from Egypt are Immigrants from Haiti (65.3%, a difference of 0.030%), Immigrants from Caribbean (65.3%, a difference of 0.040%), Immigrants from Laos (65.3%, a difference of 0.050%), Egyptian (65.4%, a difference of 0.090%), and Crow (65.3%, a difference of 0.10%).
| Demographics | Rating | Rank | Family Households |
| Puget Sound Salish | 99.8 /100 | #80 | Exceptional 65.6% |
| Jordanians | 99.7 /100 | #81 | Exceptional 65.5% |
| Immigrants | Lebanon | 99.7 /100 | #82 | Exceptional 65.5% |
| Immigrants | Guyana | 99.6 /100 | #83 | Exceptional 65.5% |
| Americans | 99.6 /100 | #84 | Exceptional 65.5% |
| Immigrants | Cambodia | 99.5 /100 | #85 | Exceptional 65.4% |
| Egyptians | 99.4 /100 | #86 | Exceptional 65.4% |
| Immigrants | Egypt | 99.2 /100 | #87 | Exceptional 65.3% |
| Immigrants | Haiti | 99.1 /100 | #88 | Exceptional 65.3% |
| Immigrants | Caribbean | 99.1 /100 | #89 | Exceptional 65.3% |
| Immigrants | Laos | 99.1 /100 | #90 | Exceptional 65.3% |
| Crow | 98.9 /100 | #91 | Exceptional 65.3% |
| Hopi | 98.8 /100 | #92 | Exceptional 65.3% |
| Guyanese | 98.8 /100 | #93 | Exceptional 65.3% |
| Immigrants | Poland | 98.7 /100 | #94 | Exceptional 65.2% |