Immigrants from Micronesia vs Hmong Currently Married
COMPARE
Immigrants from Micronesia
Hmong
Currently Married
Currently Married Comparison
Immigrants from Micronesia
Hmong
45.6%
CURRENTLY MARRIED
8.8/ 100
METRIC RATING
209th/ 347
METRIC RANK
47.1%
CURRENTLY MARRIED
73.4/ 100
METRIC RATING
144th/ 347
METRIC RANK
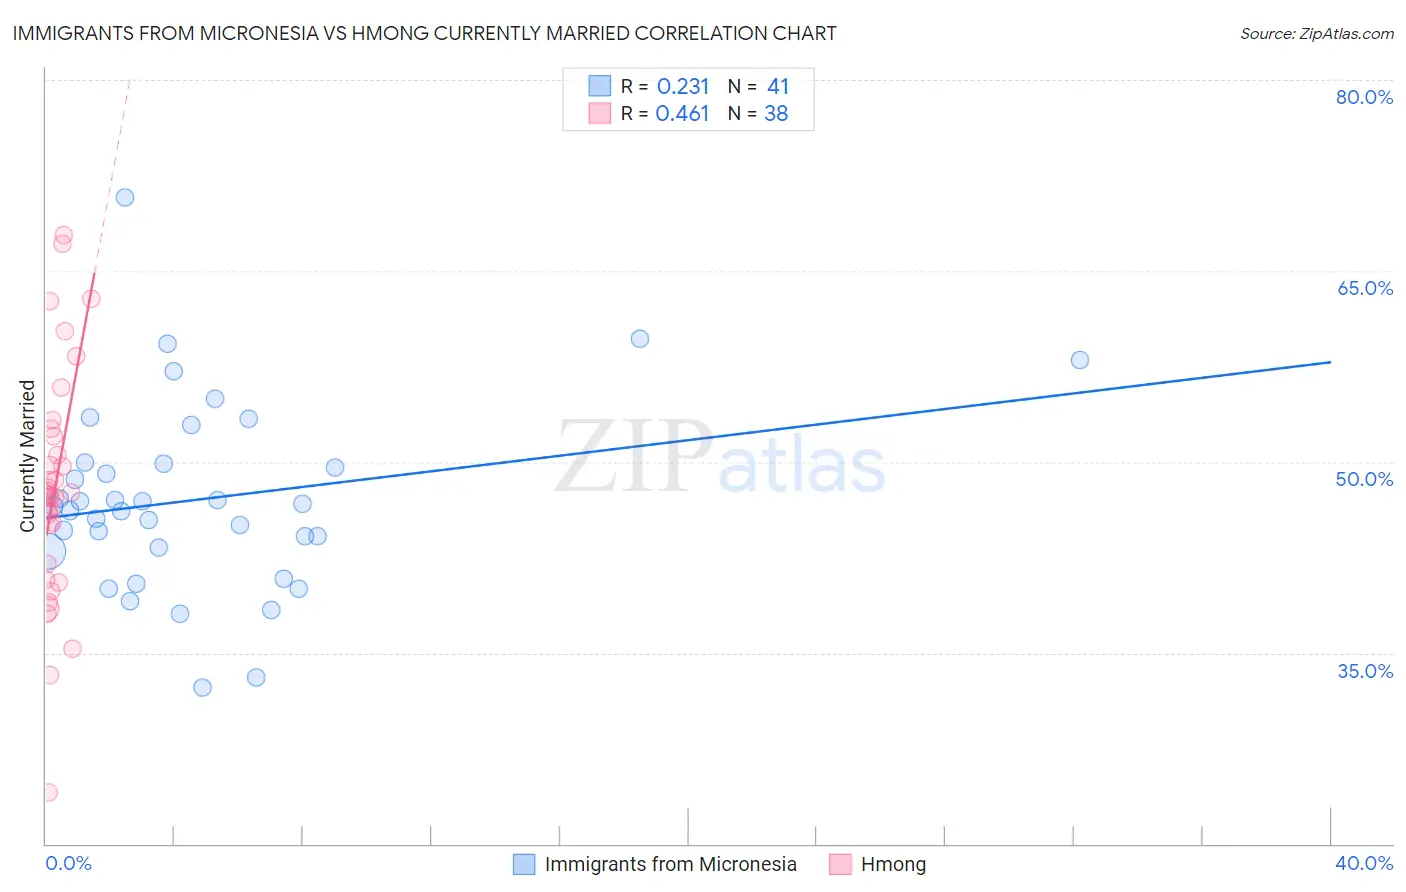
Immigrants from Micronesia vs Hmong Currently Married Correlation Chart
The statistical analysis conducted on geographies consisting of 61,606,735 people shows a weak positive correlation between the proportion of Immigrants from Micronesia and percentage of population currently married in the United States with a correlation coefficient (R) of 0.231 and weighted average of 45.6%. Similarly, the statistical analysis conducted on geographies consisting of 24,669,739 people shows a moderate positive correlation between the proportion of Hmong and percentage of population currently married in the United States with a correlation coefficient (R) of 0.461 and weighted average of 47.1%, a difference of 3.1%.
Currently Married Correlation Summary
| Measurement | Immigrants from Micronesia | Hmong |
| Minimum | 32.3% | 24.0% |
| Maximum | 70.8% | 67.8% |
| Range | 38.5% | 43.8% |
| Mean | 47.1% | 47.9% |
| Median | 46.5% | 47.4% |
| Interquartile 25% (IQ1) | 43.1% | 42.0% |
| Interquartile 75% (IQ3) | 49.9% | 52.0% |
| Interquartile Range (IQR) | 6.8% | 10.0% |
| Standard Deviation (Sample) | 7.4% | 9.1% |
| Standard Deviation (Population) | 7.3% | 9.0% |
Similar Demographics by Currently Married
Demographics Similar to Immigrants from Micronesia by Currently Married
In terms of currently married, the demographic groups most similar to Immigrants from Micronesia are Uruguayan (45.6%, a difference of 0.11%), Houma (45.5%, a difference of 0.20%), Marshallese (45.5%, a difference of 0.20%), Alsatian (45.7%, a difference of 0.21%), and Immigrants from South America (45.7%, a difference of 0.22%).
| Demographics | Rating | Rank | Currently Married |
| Immigrants | Albania | 14.5 /100 | #202 | Poor 45.9% |
| Taiwanese | 11.7 /100 | #203 | Poor 45.8% |
| Immigrants | Spain | 11.6 /100 | #204 | Poor 45.8% |
| South American Indians | 11.5 /100 | #205 | Poor 45.8% |
| Immigrants | Immigrants | 11.2 /100 | #206 | Poor 45.8% |
| Immigrants | South America | 10.8 /100 | #207 | Poor 45.7% |
| Alsatians | 10.8 /100 | #208 | Poor 45.7% |
| Immigrants | Micronesia | 8.8 /100 | #209 | Tragic 45.6% |
| Uruguayans | 7.9 /100 | #210 | Tragic 45.6% |
| Houma | 7.2 /100 | #211 | Tragic 45.5% |
| Marshallese | 7.2 /100 | #212 | Tragic 45.5% |
| Alaska Natives | 7.0 /100 | #213 | Tragic 45.5% |
| Dutch West Indians | 6.7 /100 | #214 | Tragic 45.5% |
| German Russians | 6.7 /100 | #215 | Tragic 45.5% |
| Immigrants | Morocco | 5.5 /100 | #216 | Tragic 45.4% |
Demographics Similar to Hmong by Currently Married
In terms of currently married, the demographic groups most similar to Hmong are Immigrants from South Eastern Asia (47.1%, a difference of 0.030%), Argentinean (47.1%, a difference of 0.040%), Guamanian/Chamorro (47.1%, a difference of 0.040%), Carpatho Rusyn (47.0%, a difference of 0.040%), and Venezuelan (47.1%, a difference of 0.050%).
| Demographics | Rating | Rank | Currently Married |
| Paraguayans | 77.8 /100 | #137 | Good 47.2% |
| Pakistanis | 77.5 /100 | #138 | Good 47.2% |
| Yugoslavians | 77.4 /100 | #139 | Good 47.2% |
| Cajuns | 75.3 /100 | #140 | Good 47.1% |
| Venezuelans | 74.4 /100 | #141 | Good 47.1% |
| Argentineans | 74.4 /100 | #142 | Good 47.1% |
| Guamanians/Chamorros | 74.2 /100 | #143 | Good 47.1% |
| Hmong | 73.4 /100 | #144 | Good 47.1% |
| Immigrants | South Eastern Asia | 72.9 /100 | #145 | Good 47.1% |
| Carpatho Rusyns | 72.6 /100 | #146 | Good 47.0% |
| Immigrants | Argentina | 72.0 /100 | #147 | Good 47.0% |
| Cambodians | 70.4 /100 | #148 | Good 47.0% |
| Zimbabweans | 70.1 /100 | #149 | Good 47.0% |
| Immigrants | Turkey | 70.0 /100 | #150 | Good 47.0% |
| Chileans | 69.8 /100 | #151 | Good 47.0% |