Immigrants from Laos vs Bhutanese Family Households
COMPARE
Immigrants from Laos
Bhutanese
Family Households
Family Households Comparison
Immigrants from Laos
Bhutanese
65.3%
FAMILY HOUSEHOLDS
99.1/ 100
METRIC RATING
90th/ 347
METRIC RANK
65.9%
FAMILY HOUSEHOLDS
99.9/ 100
METRIC RATING
71st/ 347
METRIC RANK
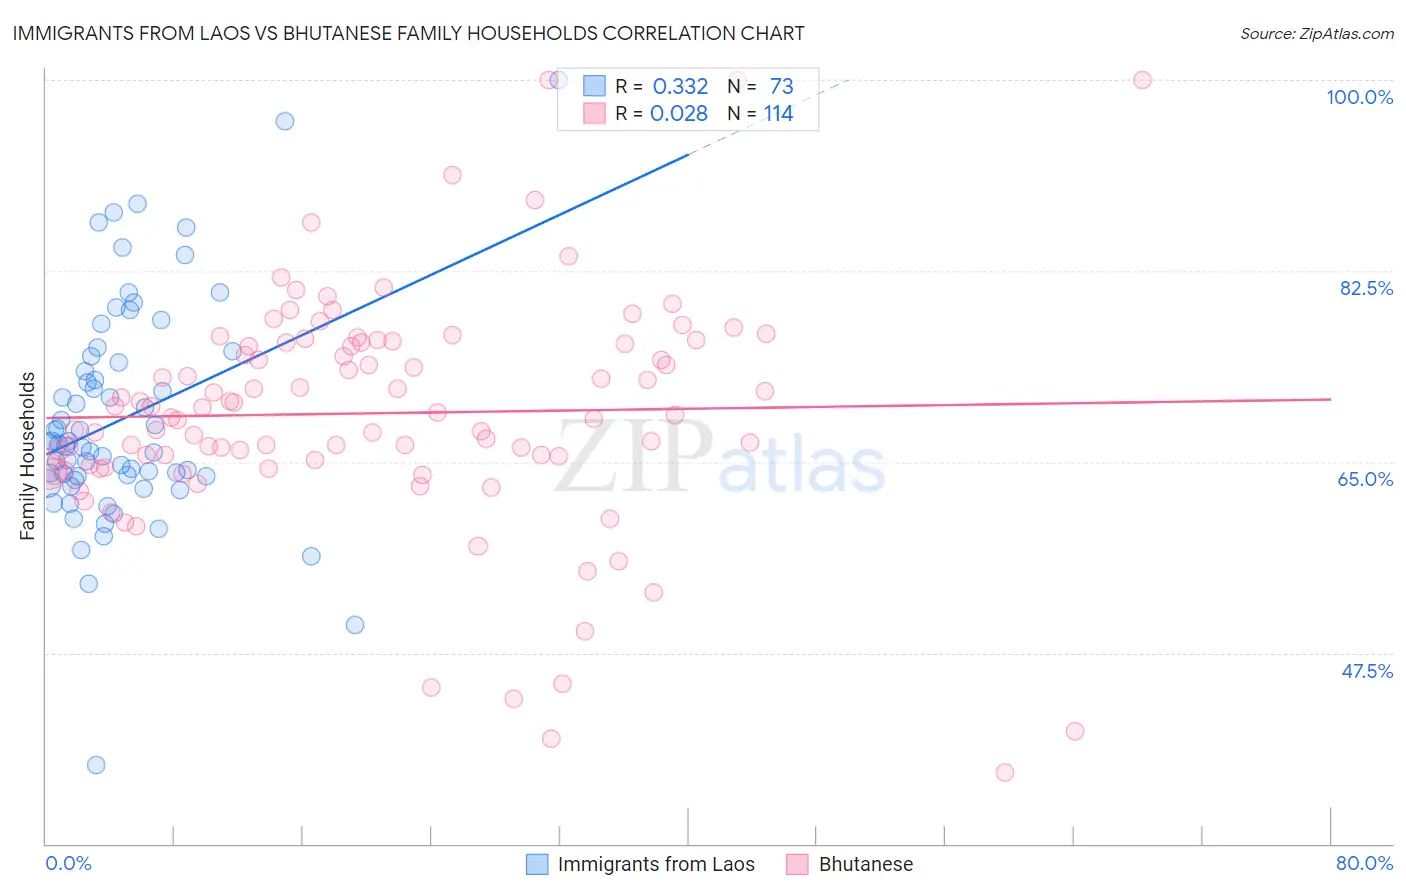
Immigrants from Laos vs Bhutanese Family Households Correlation Chart
The statistical analysis conducted on geographies consisting of 201,468,256 people shows a mild positive correlation between the proportion of Immigrants from Laos and percentage of family households in the United States with a correlation coefficient (R) of 0.332 and weighted average of 65.3%. Similarly, the statistical analysis conducted on geographies consisting of 455,147,880 people shows no correlation between the proportion of Bhutanese and percentage of family households in the United States with a correlation coefficient (R) of 0.028 and weighted average of 65.9%, a difference of 0.83%.
Family Households Correlation Summary
| Measurement | Immigrants from Laos | Bhutanese |
| Minimum | 37.2% | 36.6% |
| Maximum | 100.0% | 100.0% |
| Range | 62.8% | 63.4% |
| Mean | 69.0% | 69.5% |
| Median | 66.7% | 69.4% |
| Interquartile 25% (IQ1) | 63.5% | 64.7% |
| Interquartile 75% (IQ3) | 74.4% | 75.9% |
| Interquartile Range (IQR) | 10.9% | 11.2% |
| Standard Deviation (Sample) | 10.3% | 10.8% |
| Standard Deviation (Population) | 10.2% | 10.8% |
Demographics Similar to Immigrants from Laos and Bhutanese by Family Households
In terms of family households, the demographic groups most similar to Immigrants from Laos are Immigrants from Caribbean (65.3%, a difference of 0.010%), Immigrants from Haiti (65.3%, a difference of 0.020%), Immigrants from Egypt (65.3%, a difference of 0.050%), Egyptian (65.4%, a difference of 0.14%), and Immigrants from Cambodia (65.4%, a difference of 0.19%). Similarly, the demographic groups most similar to Bhutanese are Immigrants from Afghanistan (65.9%, a difference of 0.020%), Portuguese (65.8%, a difference of 0.050%), Laotian (65.8%, a difference of 0.13%), Burmese (65.7%, a difference of 0.16%), and Houma (65.7%, a difference of 0.22%).
| Demographics | Rating | Rank | Family Households |
| Immigrants | Afghanistan | 99.9 /100 | #70 | Exceptional 65.9% |
| Bhutanese | 99.9 /100 | #71 | Exceptional 65.9% |
| Portuguese | 99.9 /100 | #72 | Exceptional 65.8% |
| Laotians | 99.9 /100 | #73 | Exceptional 65.8% |
| Burmese | 99.9 /100 | #74 | Exceptional 65.7% |
| Houma | 99.9 /100 | #75 | Exceptional 65.7% |
| Immigrants | Azores | 99.8 /100 | #76 | Exceptional 65.6% |
| Immigrants | South America | 99.8 /100 | #77 | Exceptional 65.6% |
| Yaqui | 99.8 /100 | #78 | Exceptional 65.6% |
| Immigrants | Costa Rica | 99.8 /100 | #79 | Exceptional 65.6% |
| Puget Sound Salish | 99.8 /100 | #80 | Exceptional 65.6% |
| Jordanians | 99.7 /100 | #81 | Exceptional 65.5% |
| Immigrants | Lebanon | 99.7 /100 | #82 | Exceptional 65.5% |
| Immigrants | Guyana | 99.6 /100 | #83 | Exceptional 65.5% |
| Americans | 99.6 /100 | #84 | Exceptional 65.5% |
| Immigrants | Cambodia | 99.5 /100 | #85 | Exceptional 65.4% |
| Egyptians | 99.4 /100 | #86 | Exceptional 65.4% |
| Immigrants | Egypt | 99.2 /100 | #87 | Exceptional 65.3% |
| Immigrants | Haiti | 99.1 /100 | #88 | Exceptional 65.3% |
| Immigrants | Caribbean | 99.1 /100 | #89 | Exceptional 65.3% |
| Immigrants | Laos | 99.1 /100 | #90 | Exceptional 65.3% |