Immigrants from Kuwait vs Syrian Births to Unmarried Women
COMPARE
Immigrants from Kuwait
Syrian
Births to Unmarried Women
Births to Unmarried Women Comparison
Immigrants from Kuwait
Syrians
28.8%
BIRTHS TO UNMARRIED WOMEN
98.0/ 100
METRIC RATING
83rd/ 347
METRIC RANK
30.2%
BIRTHS TO UNMARRIED WOMEN
88.2/ 100
METRIC RATING
123rd/ 347
METRIC RANK
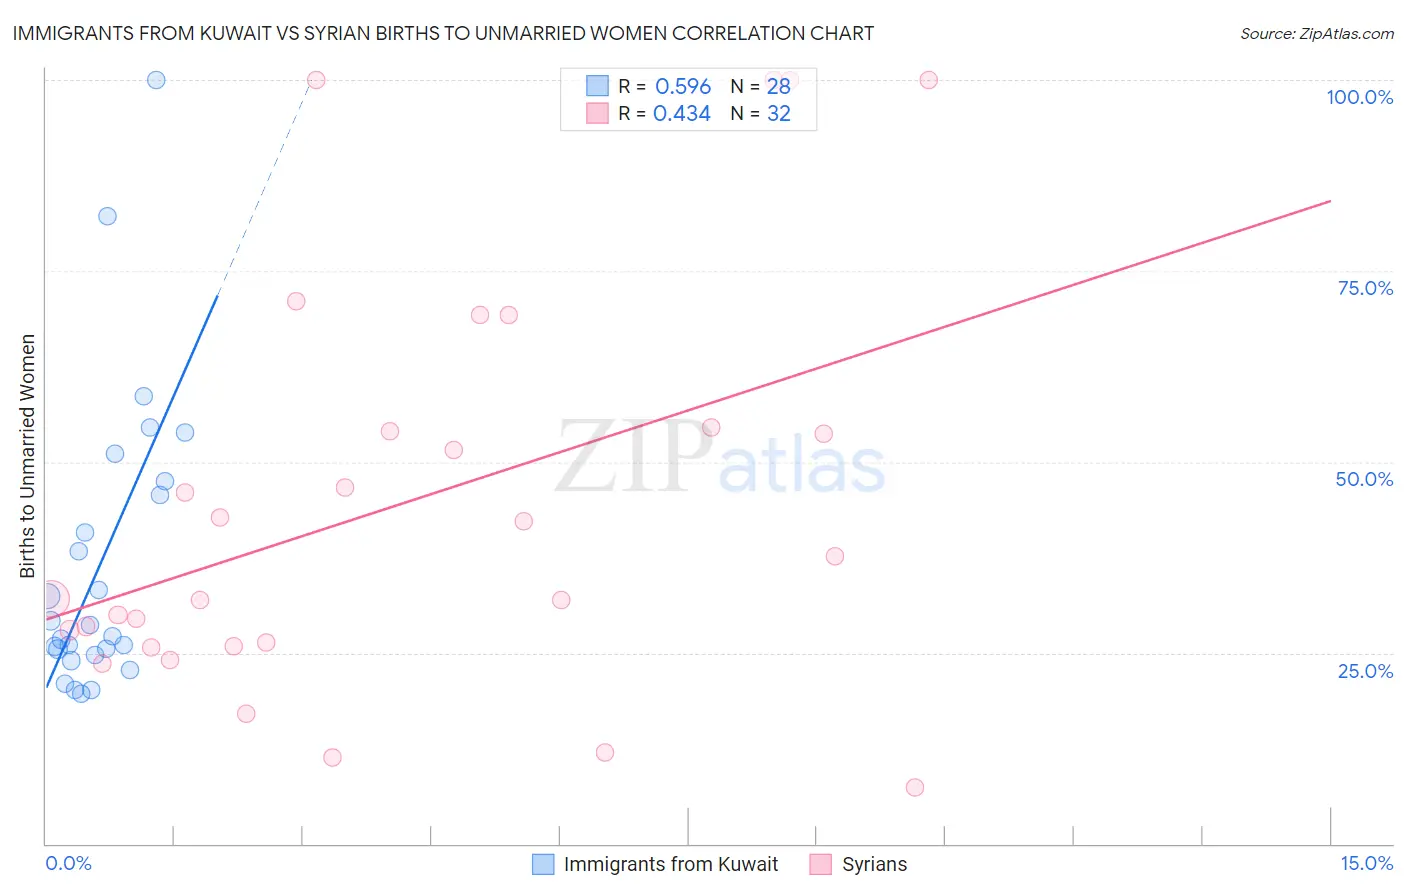
Immigrants from Kuwait vs Syrian Births to Unmarried Women Correlation Chart
The statistical analysis conducted on geographies consisting of 132,321,257 people shows a substantial positive correlation between the proportion of Immigrants from Kuwait and percentage of births to unmarried women in the United States with a correlation coefficient (R) of 0.596 and weighted average of 28.8%. Similarly, the statistical analysis conducted on geographies consisting of 250,644,243 people shows a moderate positive correlation between the proportion of Syrians and percentage of births to unmarried women in the United States with a correlation coefficient (R) of 0.434 and weighted average of 30.2%, a difference of 4.9%.
Births to Unmarried Women Correlation Summary
| Measurement | Immigrants from Kuwait | Syrian |
| Minimum | 19.6% | 7.3% |
| Maximum | 100.0% | 100.0% |
| Range | 80.4% | 92.7% |
| Mean | 36.8% | 44.5% |
| Median | 27.9% | 34.9% |
| Interquartile 25% (IQ1) | 25.1% | 26.1% |
| Interquartile 75% (IQ3) | 46.5% | 54.3% |
| Interquartile Range (IQR) | 21.4% | 28.2% |
| Standard Deviation (Sample) | 19.3% | 26.8% |
| Standard Deviation (Population) | 19.0% | 26.4% |
Similar Demographics by Births to Unmarried Women
Demographics Similar to Immigrants from Kuwait by Births to Unmarried Women
In terms of births to unmarried women, the demographic groups most similar to Immigrants from Kuwait are Romanian (28.7%, a difference of 0.080%), Immigrants from Austria (28.7%, a difference of 0.18%), Immigrants from Afghanistan (28.7%, a difference of 0.23%), Danish (28.7%, a difference of 0.25%), and Zimbabwean (28.7%, a difference of 0.27%).
| Demographics | Rating | Rank | Births to Unmarried Women |
| Israelis | 98.4 /100 | #76 | Exceptional 28.6% |
| Immigrants | Northern Europe | 98.3 /100 | #77 | Exceptional 28.6% |
| Zimbabweans | 98.2 /100 | #78 | Exceptional 28.7% |
| Danes | 98.2 /100 | #79 | Exceptional 28.7% |
| Immigrants | Afghanistan | 98.1 /100 | #80 | Exceptional 28.7% |
| Immigrants | Austria | 98.1 /100 | #81 | Exceptional 28.7% |
| Romanians | 98.0 /100 | #82 | Exceptional 28.7% |
| Immigrants | Kuwait | 98.0 /100 | #83 | Exceptional 28.8% |
| Immigrants | Poland | 97.6 /100 | #84 | Exceptional 28.9% |
| Sri Lankans | 97.5 /100 | #85 | Exceptional 28.9% |
| Immigrants | Jordan | 97.4 /100 | #86 | Exceptional 29.0% |
| Taiwanese | 97.3 /100 | #87 | Exceptional 29.0% |
| Immigrants | France | 97.3 /100 | #88 | Exceptional 29.0% |
| Immigrants | Saudi Arabia | 97.0 /100 | #89 | Exceptional 29.1% |
| Immigrants | Latvia | 96.8 /100 | #90 | Exceptional 29.1% |
Demographics Similar to Syrians by Births to Unmarried Women
In terms of births to unmarried women, the demographic groups most similar to Syrians are Croatian (30.2%, a difference of 0.040%), Vietnamese (30.2%, a difference of 0.11%), Immigrants from Argentina (30.1%, a difference of 0.13%), Korean (30.1%, a difference of 0.18%), and European (30.2%, a difference of 0.23%).
| Demographics | Rating | Rank | Births to Unmarried Women |
| Immigrants | Italy | 91.7 /100 | #116 | Exceptional 29.9% |
| Immigrants | Netherlands | 91.1 /100 | #117 | Exceptional 29.9% |
| Immigrants | Norway | 91.0 /100 | #118 | Exceptional 29.9% |
| Argentineans | 90.5 /100 | #119 | Exceptional 30.0% |
| Ugandans | 89.2 /100 | #120 | Excellent 30.1% |
| Koreans | 88.9 /100 | #121 | Excellent 30.1% |
| Immigrants | Argentina | 88.7 /100 | #122 | Excellent 30.1% |
| Syrians | 88.2 /100 | #123 | Excellent 30.2% |
| Croatians | 88.0 /100 | #124 | Excellent 30.2% |
| Vietnamese | 87.7 /100 | #125 | Excellent 30.2% |
| Europeans | 87.2 /100 | #126 | Excellent 30.2% |
| Chinese | 87.1 /100 | #127 | Excellent 30.2% |
| Icelanders | 86.0 /100 | #128 | Excellent 30.3% |
| Immigrants | Spain | 85.8 /100 | #129 | Excellent 30.3% |
| Immigrants | Bosnia and Herzegovina | 85.7 /100 | #130 | Excellent 30.3% |