Immigrants from Kuwait vs Immigrants from Philippines Births to Unmarried Women
COMPARE
Immigrants from Kuwait
Immigrants from Philippines
Births to Unmarried Women
Births to Unmarried Women Comparison
Immigrants from Kuwait
Immigrants from Philippines
28.8%
BIRTHS TO UNMARRIED WOMEN
98.0/ 100
METRIC RATING
83rd/ 347
METRIC RANK
30.4%
BIRTHS TO UNMARRIED WOMEN
83.9/ 100
METRIC RATING
137th/ 347
METRIC RANK
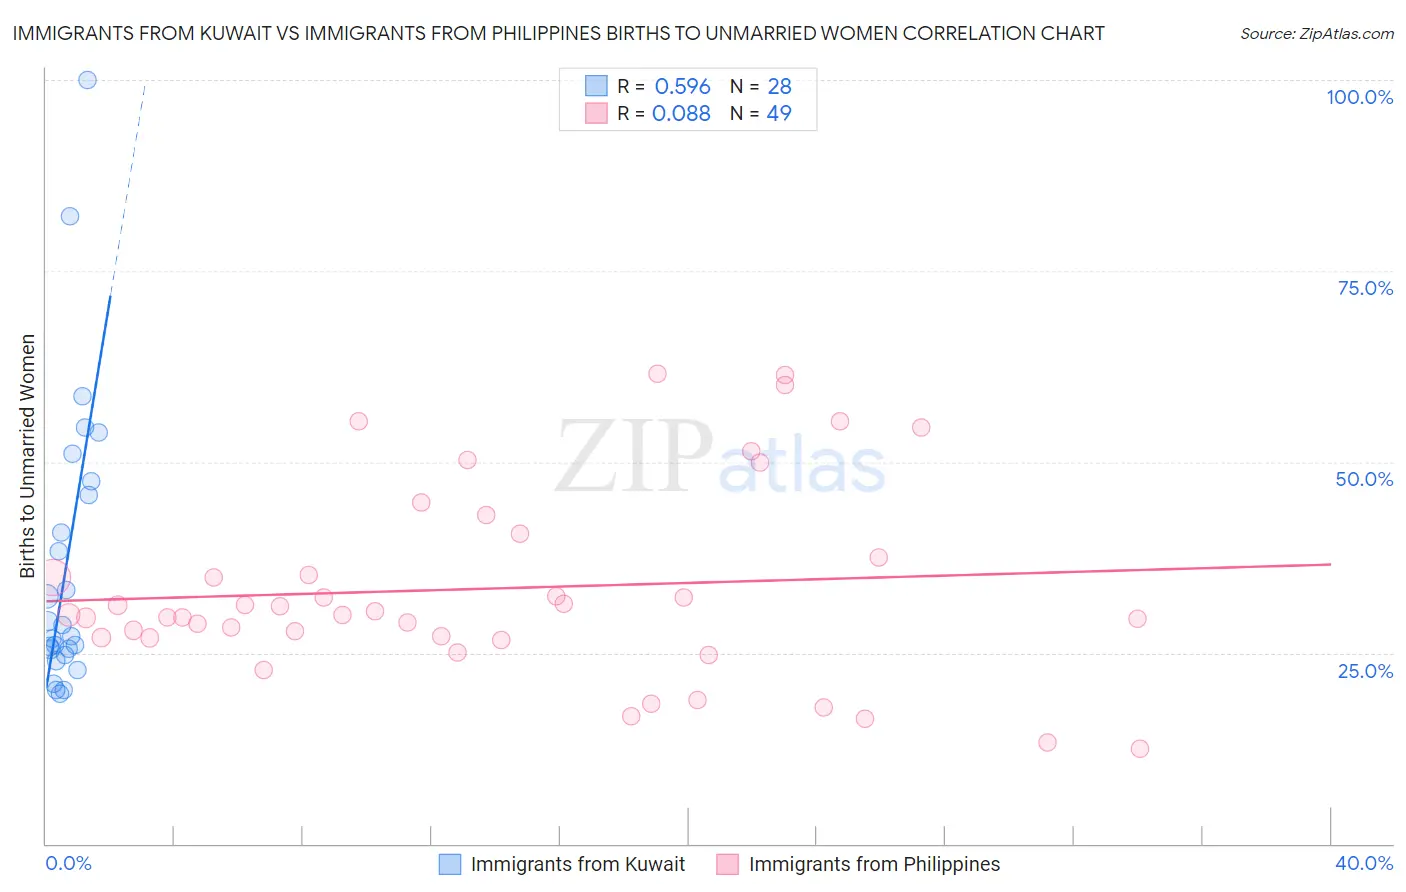
Immigrants from Kuwait vs Immigrants from Philippines Births to Unmarried Women Correlation Chart
The statistical analysis conducted on geographies consisting of 132,321,257 people shows a substantial positive correlation between the proportion of Immigrants from Kuwait and percentage of births to unmarried women in the United States with a correlation coefficient (R) of 0.596 and weighted average of 28.8%. Similarly, the statistical analysis conducted on geographies consisting of 435,603,285 people shows a slight positive correlation between the proportion of Immigrants from Philippines and percentage of births to unmarried women in the United States with a correlation coefficient (R) of 0.088 and weighted average of 30.4%, a difference of 5.8%.
Births to Unmarried Women Correlation Summary
| Measurement | Immigrants from Kuwait | Immigrants from Philippines |
| Minimum | 19.6% | 12.5% |
| Maximum | 100.0% | 61.5% |
| Range | 80.4% | 49.0% |
| Mean | 36.8% | 33.4% |
| Median | 27.9% | 30.0% |
| Interquartile 25% (IQ1) | 25.1% | 27.0% |
| Interquartile 75% (IQ3) | 46.5% | 39.0% |
| Interquartile Range (IQR) | 21.4% | 12.0% |
| Standard Deviation (Sample) | 19.3% | 12.6% |
| Standard Deviation (Population) | 19.0% | 12.5% |
Similar Demographics by Births to Unmarried Women
Demographics Similar to Immigrants from Kuwait by Births to Unmarried Women
In terms of births to unmarried women, the demographic groups most similar to Immigrants from Kuwait are Romanian (28.7%, a difference of 0.080%), Immigrants from Austria (28.7%, a difference of 0.18%), Immigrants from Afghanistan (28.7%, a difference of 0.23%), Danish (28.7%, a difference of 0.25%), and Zimbabwean (28.7%, a difference of 0.27%).
| Demographics | Rating | Rank | Births to Unmarried Women |
| Israelis | 98.4 /100 | #76 | Exceptional 28.6% |
| Immigrants | Northern Europe | 98.3 /100 | #77 | Exceptional 28.6% |
| Zimbabweans | 98.2 /100 | #78 | Exceptional 28.7% |
| Danes | 98.2 /100 | #79 | Exceptional 28.7% |
| Immigrants | Afghanistan | 98.1 /100 | #80 | Exceptional 28.7% |
| Immigrants | Austria | 98.1 /100 | #81 | Exceptional 28.7% |
| Romanians | 98.0 /100 | #82 | Exceptional 28.7% |
| Immigrants | Kuwait | 98.0 /100 | #83 | Exceptional 28.8% |
| Immigrants | Poland | 97.6 /100 | #84 | Exceptional 28.9% |
| Sri Lankans | 97.5 /100 | #85 | Exceptional 28.9% |
| Immigrants | Jordan | 97.4 /100 | #86 | Exceptional 29.0% |
| Taiwanese | 97.3 /100 | #87 | Exceptional 29.0% |
| Immigrants | France | 97.3 /100 | #88 | Exceptional 29.0% |
| Immigrants | Saudi Arabia | 97.0 /100 | #89 | Exceptional 29.1% |
| Immigrants | Latvia | 96.8 /100 | #90 | Exceptional 29.1% |
Demographics Similar to Immigrants from Philippines by Births to Unmarried Women
In terms of births to unmarried women, the demographic groups most similar to Immigrants from Philippines are Puget Sound Salish (30.4%, a difference of 0.0%), Immigrants from Canada (30.4%, a difference of 0.040%), Immigrants from Scotland (30.4%, a difference of 0.13%), Swiss (30.5%, a difference of 0.14%), and Brazilian (30.4%, a difference of 0.16%).
| Demographics | Rating | Rank | Births to Unmarried Women |
| Immigrants | Bosnia and Herzegovina | 85.7 /100 | #130 | Excellent 30.3% |
| Immigrants | Zimbabwe | 85.7 /100 | #131 | Excellent 30.3% |
| New Zealanders | 85.5 /100 | #132 | Excellent 30.3% |
| Immigrants | Morocco | 85.2 /100 | #133 | Excellent 30.4% |
| Immigrants | South Eastern Asia | 85.2 /100 | #134 | Excellent 30.4% |
| Brazilians | 84.8 /100 | #135 | Excellent 30.4% |
| Immigrants | Scotland | 84.6 /100 | #136 | Excellent 30.4% |
| Immigrants | Philippines | 83.9 /100 | #137 | Excellent 30.4% |
| Puget Sound Salish | 83.9 /100 | #138 | Excellent 30.4% |
| Immigrants | Canada | 83.7 /100 | #139 | Excellent 30.4% |
| Swiss | 83.1 /100 | #140 | Excellent 30.5% |
| Pakistanis | 83.0 /100 | #141 | Excellent 30.5% |
| South Africans | 82.7 /100 | #142 | Excellent 30.5% |
| Immigrants | Uganda | 82.6 /100 | #143 | Excellent 30.5% |
| Czechs | 82.1 /100 | #144 | Excellent 30.5% |