Immigrants from Jamaica vs Immigrants from Belarus Births to Unmarried Women
COMPARE
Immigrants from Jamaica
Immigrants from Belarus
Births to Unmarried Women
Births to Unmarried Women Comparison
Immigrants from Jamaica
Immigrants from Belarus
38.8%
BIRTHS TO UNMARRIED WOMEN
0.0/ 100
METRIC RATING
303rd/ 347
METRIC RANK
25.6%
BIRTHS TO UNMARRIED WOMEN
100.0/ 100
METRIC RATING
16th/ 347
METRIC RANK
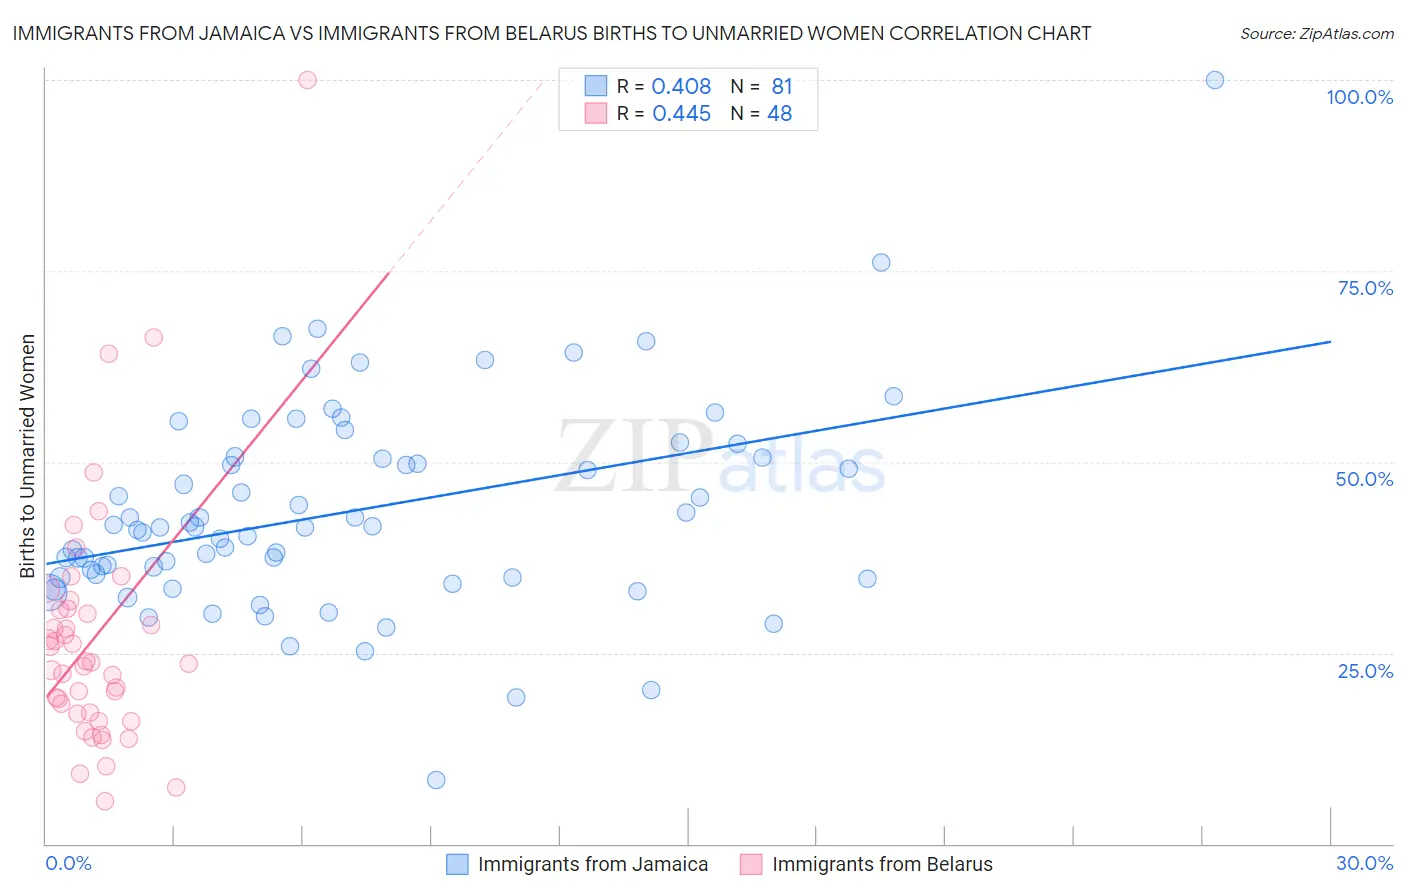
Immigrants from Jamaica vs Immigrants from Belarus Births to Unmarried Women Correlation Chart
The statistical analysis conducted on geographies consisting of 287,311,689 people shows a moderate positive correlation between the proportion of Immigrants from Jamaica and percentage of births to unmarried women in the United States with a correlation coefficient (R) of 0.408 and weighted average of 38.8%. Similarly, the statistical analysis conducted on geographies consisting of 142,991,373 people shows a moderate positive correlation between the proportion of Immigrants from Belarus and percentage of births to unmarried women in the United States with a correlation coefficient (R) of 0.445 and weighted average of 25.6%, a difference of 51.3%.
Births to Unmarried Women Correlation Summary
| Measurement | Immigrants from Jamaica | Immigrants from Belarus |
| Minimum | 8.3% | 5.6% |
| Maximum | 100.0% | 100.0% |
| Range | 91.7% | 94.4% |
| Mean | 43.5% | 27.0% |
| Median | 41.4% | 23.7% |
| Interquartile 25% (IQ1) | 34.8% | 17.1% |
| Interquartile 75% (IQ3) | 50.6% | 30.7% |
| Interquartile Range (IQR) | 15.8% | 13.5% |
| Standard Deviation (Sample) | 13.7% | 16.5% |
| Standard Deviation (Population) | 13.6% | 16.3% |
Similar Demographics by Births to Unmarried Women
Demographics Similar to Immigrants from Jamaica by Births to Unmarried Women
In terms of births to unmarried women, the demographic groups most similar to Immigrants from Jamaica are Yaqui (38.8%, a difference of 0.050%), Immigrants from Haiti (38.9%, a difference of 0.15%), Honduran (38.7%, a difference of 0.32%), Central American Indian (39.0%, a difference of 0.44%), and Haitian (38.6%, a difference of 0.56%).
| Demographics | Rating | Rank | Births to Unmarried Women |
| Alaska Natives | 0.0 /100 | #296 | Tragic 38.3% |
| Dutch West Indians | 0.0 /100 | #297 | Tragic 38.4% |
| Jamaicans | 0.0 /100 | #298 | Tragic 38.5% |
| Spanish Americans | 0.0 /100 | #299 | Tragic 38.6% |
| Immigrants | West Indies | 0.0 /100 | #300 | Tragic 38.6% |
| Haitians | 0.0 /100 | #301 | Tragic 38.6% |
| Hondurans | 0.0 /100 | #302 | Tragic 38.7% |
| Immigrants | Jamaica | 0.0 /100 | #303 | Tragic 38.8% |
| Yaqui | 0.0 /100 | #304 | Tragic 38.8% |
| Immigrants | Haiti | 0.0 /100 | #305 | Tragic 38.9% |
| Central American Indians | 0.0 /100 | #306 | Tragic 39.0% |
| Immigrants | Honduras | 0.0 /100 | #307 | Tragic 39.3% |
| Aleuts | 0.0 /100 | #308 | Tragic 39.3% |
| Cubans | 0.0 /100 | #309 | Tragic 39.4% |
| Immigrants | Dominica | 0.0 /100 | #310 | Tragic 39.5% |
Demographics Similar to Immigrants from Belarus by Births to Unmarried Women
In terms of births to unmarried women, the demographic groups most similar to Immigrants from Belarus are Immigrants from Singapore (25.6%, a difference of 0.050%), Immigrants from Uzbekistan (25.8%, a difference of 0.57%), Immigrants from Lebanon (25.3%, a difference of 1.2%), Iranian (25.3%, a difference of 1.3%), and Indian (Asian) (25.3%, a difference of 1.5%).
| Demographics | Rating | Rank | Births to Unmarried Women |
| Immigrants | South Central Asia | 100.0 /100 | #9 | Exceptional 24.7% |
| Immigrants | Eastern Asia | 100.0 /100 | #10 | Exceptional 25.0% |
| Immigrants | Israel | 100.0 /100 | #11 | Exceptional 25.1% |
| Indians (Asian) | 100.0 /100 | #12 | Exceptional 25.3% |
| Iranians | 100.0 /100 | #13 | Exceptional 25.3% |
| Immigrants | Lebanon | 100.0 /100 | #14 | Exceptional 25.3% |
| Immigrants | Singapore | 100.0 /100 | #15 | Exceptional 25.6% |
| Immigrants | Belarus | 100.0 /100 | #16 | Exceptional 25.6% |
| Immigrants | Uzbekistan | 100.0 /100 | #17 | Exceptional 25.8% |
| Immigrants | Armenia | 99.9 /100 | #18 | Exceptional 26.1% |
| Armenians | 99.9 /100 | #19 | Exceptional 26.2% |
| Immigrants | Korea | 99.9 /100 | #20 | Exceptional 26.3% |
| Soviet Union | 99.9 /100 | #21 | Exceptional 26.3% |
| Burmese | 99.9 /100 | #22 | Exceptional 26.4% |
| Immigrants | Japan | 99.9 /100 | #23 | Exceptional 26.4% |