Immigrants from Jamaica vs Crow Births to Unmarried Women
COMPARE
Immigrants from Jamaica
Crow
Births to Unmarried Women
Births to Unmarried Women Comparison
Immigrants from Jamaica
Crow
38.8%
BIRTHS TO UNMARRIED WOMEN
0.0/ 100
METRIC RATING
303rd/ 347
METRIC RANK
40.4%
BIRTHS TO UNMARRIED WOMEN
0.0/ 100
METRIC RATING
320th/ 347
METRIC RANK
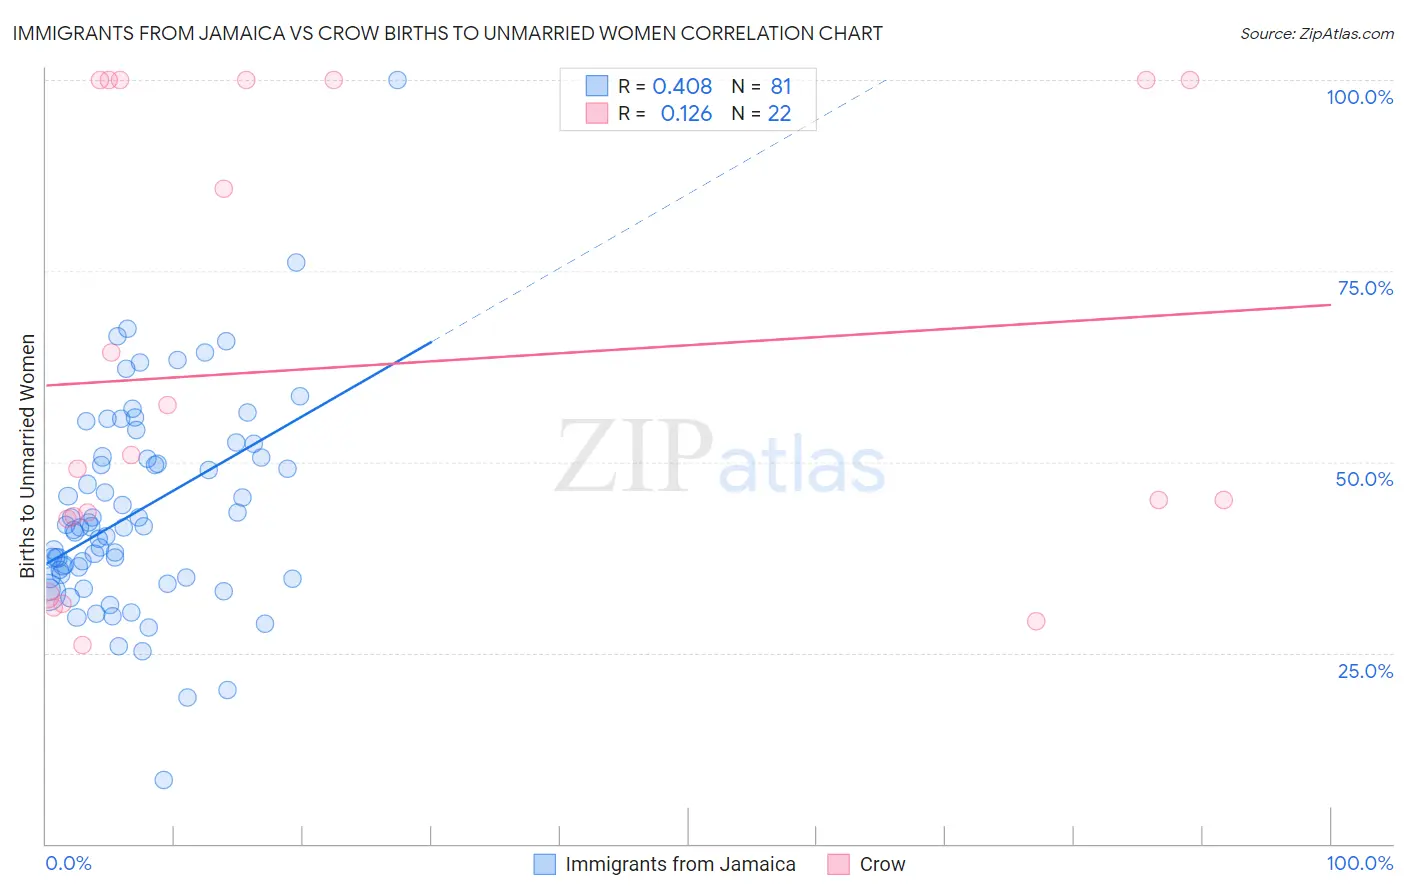
Immigrants from Jamaica vs Crow Births to Unmarried Women Correlation Chart
The statistical analysis conducted on geographies consisting of 287,311,689 people shows a moderate positive correlation between the proportion of Immigrants from Jamaica and percentage of births to unmarried women in the United States with a correlation coefficient (R) of 0.408 and weighted average of 38.8%. Similarly, the statistical analysis conducted on geographies consisting of 58,263,233 people shows a poor positive correlation between the proportion of Crow and percentage of births to unmarried women in the United States with a correlation coefficient (R) of 0.126 and weighted average of 40.4%, a difference of 4.0%.
Births to Unmarried Women Correlation Summary
| Measurement | Immigrants from Jamaica | Crow |
| Minimum | 8.3% | 26.1% |
| Maximum | 100.0% | 100.0% |
| Range | 91.7% | 73.9% |
| Mean | 43.5% | 62.6% |
| Median | 41.4% | 50.0% |
| Interquartile 25% (IQ1) | 34.8% | 42.5% |
| Interquartile 75% (IQ3) | 50.6% | 100.0% |
| Interquartile Range (IQR) | 15.8% | 57.5% |
| Standard Deviation (Sample) | 13.7% | 29.1% |
| Standard Deviation (Population) | 13.6% | 28.4% |
Demographics Similar to Immigrants from Jamaica and Crow by Births to Unmarried Women
In terms of births to unmarried women, the demographic groups most similar to Immigrants from Jamaica are Yaqui (38.8%, a difference of 0.050%), Immigrants from Haiti (38.9%, a difference of 0.15%), Honduran (38.7%, a difference of 0.32%), Central American Indian (39.0%, a difference of 0.44%), and Haitian (38.6%, a difference of 0.56%). Similarly, the demographic groups most similar to Crow are Yakama (40.3%, a difference of 0.060%), Immigrants from Bahamas (40.1%, a difference of 0.61%), Immigrants from Dominican Republic (40.1%, a difference of 0.68%), Bahamian (40.8%, a difference of 1.0%), and Apache (39.9%, a difference of 1.2%).
| Demographics | Rating | Rank | Births to Unmarried Women |
| Haitians | 0.0 /100 | #301 | Tragic 38.6% |
| Hondurans | 0.0 /100 | #302 | Tragic 38.7% |
| Immigrants | Jamaica | 0.0 /100 | #303 | Tragic 38.8% |
| Yaqui | 0.0 /100 | #304 | Tragic 38.8% |
| Immigrants | Haiti | 0.0 /100 | #305 | Tragic 38.9% |
| Central American Indians | 0.0 /100 | #306 | Tragic 39.0% |
| Immigrants | Honduras | 0.0 /100 | #307 | Tragic 39.3% |
| Aleuts | 0.0 /100 | #308 | Tragic 39.3% |
| Cubans | 0.0 /100 | #309 | Tragic 39.4% |
| Immigrants | Dominica | 0.0 /100 | #310 | Tragic 39.5% |
| Immigrants | Azores | 0.0 /100 | #311 | Tragic 39.6% |
| U.S. Virgin Islanders | 0.0 /100 | #312 | Tragic 39.6% |
| Africans | 0.0 /100 | #313 | Tragic 39.7% |
| Immigrants | Caribbean | 0.0 /100 | #314 | Tragic 39.8% |
| Dominicans | 0.0 /100 | #315 | Tragic 39.8% |
| Apache | 0.0 /100 | #316 | Tragic 39.9% |
| Immigrants | Dominican Republic | 0.0 /100 | #317 | Tragic 40.1% |
| Immigrants | Bahamas | 0.0 /100 | #318 | Tragic 40.1% |
| Yakama | 0.0 /100 | #319 | Tragic 40.3% |
| Crow | 0.0 /100 | #320 | Tragic 40.4% |
| Bahamians | 0.0 /100 | #321 | Tragic 40.8% |