Immigrants from Ireland vs Romanian Married-couple Households
COMPARE
Immigrants from Ireland
Romanian
Married-couple Households
Married-couple Households Comparison
Immigrants from Ireland
Romanians
48.0%
MARRIED-COUPLE HOUSEHOLDS
97.3/ 100
METRIC RATING
87th/ 347
METRIC RANK
48.4%
MARRIED-COUPLE HOUSEHOLDS
98.9/ 100
METRIC RATING
67th/ 347
METRIC RANK
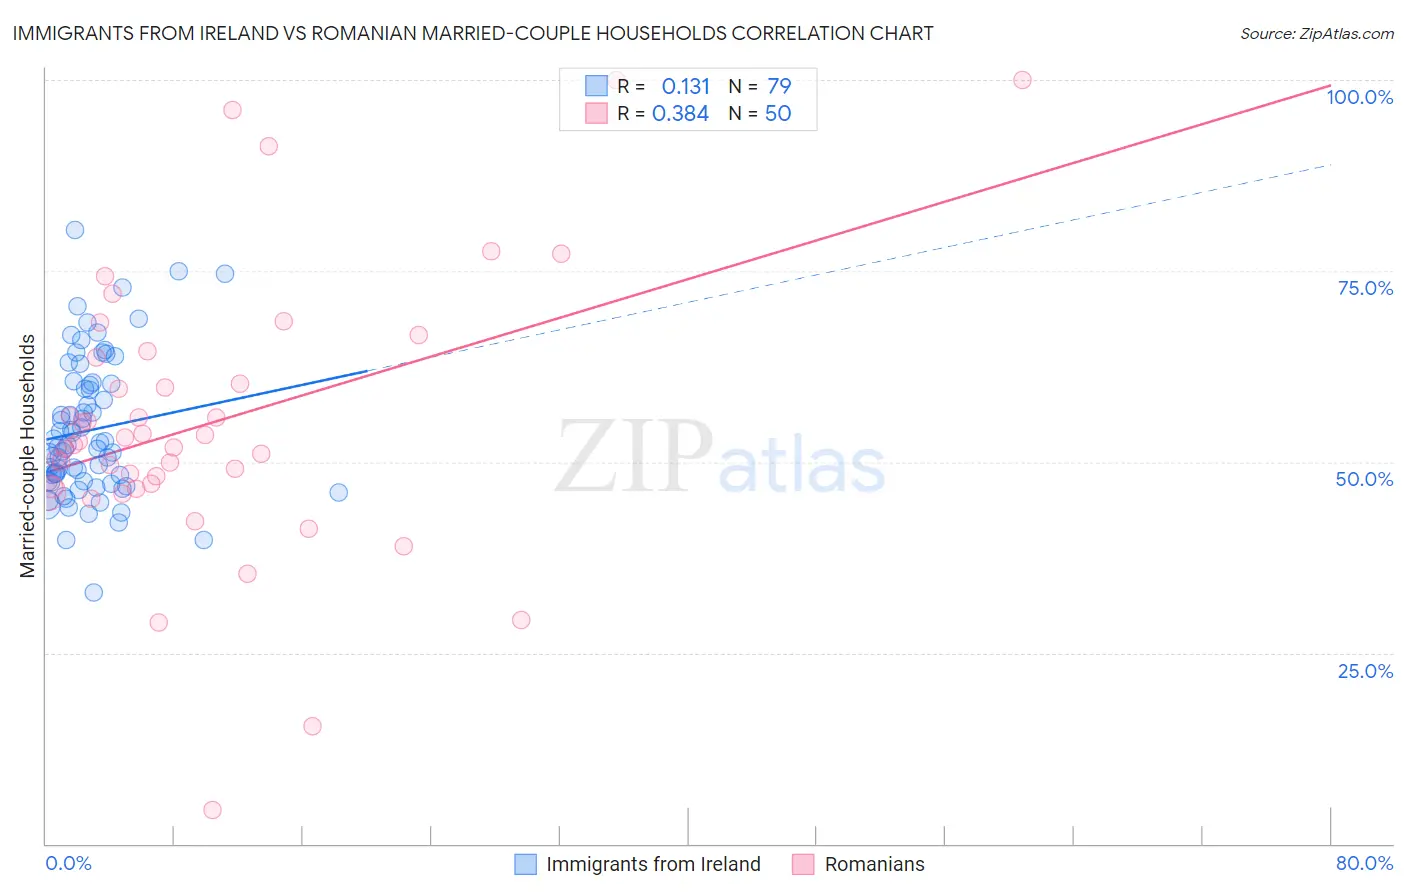
Immigrants from Ireland vs Romanian Married-couple Households Correlation Chart
The statistical analysis conducted on geographies consisting of 240,743,344 people shows a poor positive correlation between the proportion of Immigrants from Ireland and percentage of married-couple family households in the United States with a correlation coefficient (R) of 0.131 and weighted average of 48.0%. Similarly, the statistical analysis conducted on geographies consisting of 377,697,282 people shows a mild positive correlation between the proportion of Romanians and percentage of married-couple family households in the United States with a correlation coefficient (R) of 0.384 and weighted average of 48.4%, a difference of 0.84%.
Married-couple Households Correlation Summary
| Measurement | Immigrants from Ireland | Romanian |
| Minimum | 32.8% | 4.5% |
| Maximum | 80.3% | 100.0% |
| Range | 47.5% | 95.5% |
| Mean | 54.1% | 55.1% |
| Median | 51.9% | 52.5% |
| Interquartile 25% (IQ1) | 47.4% | 46.7% |
| Interquartile 75% (IQ3) | 60.2% | 63.6% |
| Interquartile Range (IQR) | 12.8% | 17.0% |
| Standard Deviation (Sample) | 9.2% | 18.4% |
| Standard Deviation (Population) | 9.1% | 18.3% |
Demographics Similar to Immigrants from Ireland and Romanians by Married-couple Households
In terms of married-couple households, the demographic groups most similar to Immigrants from Ireland are Belgian (48.0%, a difference of 0.010%), Immigrants from Israel (48.0%, a difference of 0.040%), Ukrainian (48.1%, a difference of 0.080%), Guamanian/Chamorro (48.1%, a difference of 0.11%), and Immigrants from Poland (48.1%, a difference of 0.13%). Similarly, the demographic groups most similar to Romanians are Immigrants from South Eastern Asia (48.4%, a difference of 0.010%), Immigrants from China (48.4%, a difference of 0.010%), Immigrants from North America (48.4%, a difference of 0.060%), Laotian (48.4%, a difference of 0.070%), and Scotch-Irish (48.3%, a difference of 0.24%).
| Demographics | Rating | Rank | Married-couple Households |
| Romanians | 98.9 /100 | #67 | Exceptional 48.4% |
| Immigrants | South Eastern Asia | 98.9 /100 | #68 | Exceptional 48.4% |
| Immigrants | China | 98.9 /100 | #69 | Exceptional 48.4% |
| Immigrants | North America | 98.9 /100 | #70 | Exceptional 48.4% |
| Laotians | 98.8 /100 | #71 | Exceptional 48.4% |
| Scotch-Irish | 98.6 /100 | #72 | Exceptional 48.3% |
| Immigrants | Singapore | 98.6 /100 | #73 | Exceptional 48.3% |
| Immigrants | Romania | 98.6 /100 | #74 | Exceptional 48.3% |
| Immigrants | England | 98.4 /100 | #75 | Exceptional 48.2% |
| Immigrants | Fiji | 98.4 /100 | #76 | Exceptional 48.2% |
| Canadians | 98.2 /100 | #77 | Exceptional 48.2% |
| Egyptians | 98.2 /100 | #78 | Exceptional 48.2% |
| Immigrants | Netherlands | 98.2 /100 | #79 | Exceptional 48.2% |
| Russians | 98.1 /100 | #80 | Exceptional 48.2% |
| Finns | 98.0 /100 | #81 | Exceptional 48.1% |
| Immigrants | Poland | 97.7 /100 | #82 | Exceptional 48.1% |
| Guamanians/Chamorros | 97.6 /100 | #83 | Exceptional 48.1% |
| Ukrainians | 97.6 /100 | #84 | Exceptional 48.1% |
| Immigrants | Israel | 97.4 /100 | #85 | Exceptional 48.0% |
| Belgians | 97.4 /100 | #86 | Exceptional 48.0% |
| Immigrants | Ireland | 97.3 /100 | #87 | Exceptional 48.0% |