Immigrants from Grenada vs Alsatian Married-couple Households
COMPARE
Immigrants from Grenada
Alsatian
Married-couple Households
Married-couple Households Comparison
Immigrants from Grenada
Alsatians
37.5%
MARRIED-COUPLE HOUSEHOLDS
0.0/ 100
METRIC RATING
343rd/ 347
METRIC RANK
44.8%
MARRIED-COUPLE HOUSEHOLDS
2.3/ 100
METRIC RATING
226th/ 347
METRIC RANK
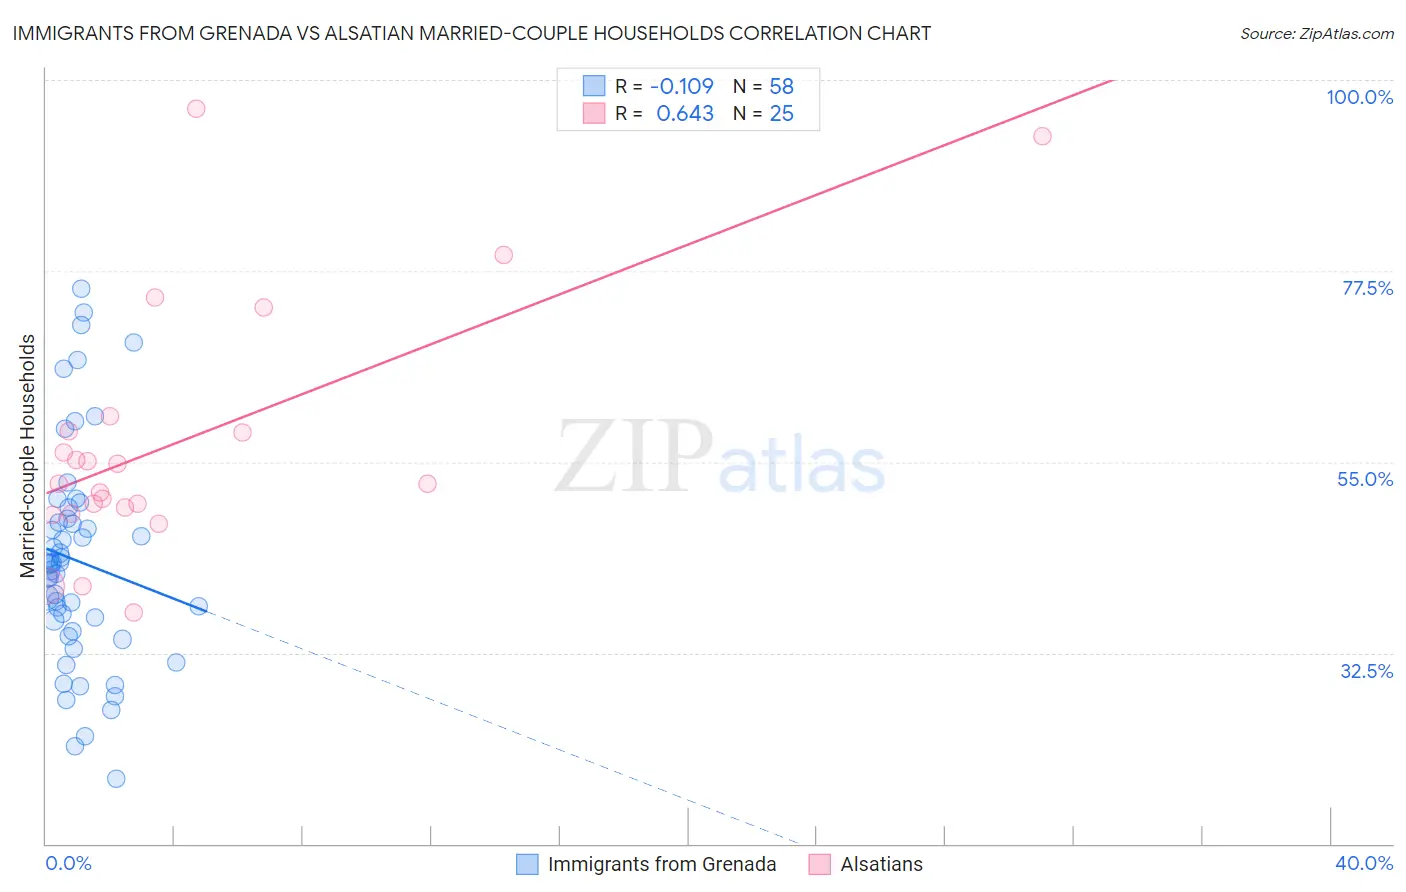
Immigrants from Grenada vs Alsatian Married-couple Households Correlation Chart
The statistical analysis conducted on geographies consisting of 67,190,411 people shows a poor negative correlation between the proportion of Immigrants from Grenada and percentage of married-couple family households in the United States with a correlation coefficient (R) of -0.109 and weighted average of 37.5%. Similarly, the statistical analysis conducted on geographies consisting of 82,680,020 people shows a significant positive correlation between the proportion of Alsatians and percentage of married-couple family households in the United States with a correlation coefficient (R) of 0.643 and weighted average of 44.8%, a difference of 19.5%.
Married-couple Households Correlation Summary
| Measurement | Immigrants from Grenada | Alsatian |
| Minimum | 17.7% | 37.3% |
| Maximum | 75.4% | 96.6% |
| Range | 57.7% | 59.3% |
| Mean | 43.4% | 57.4% |
| Median | 43.0% | 52.4% |
| Interquartile 25% (IQ1) | 35.1% | 49.3% |
| Interquartile 75% (IQ3) | 48.3% | 59.5% |
| Interquartile Range (IQR) | 13.3% | 10.2% |
| Standard Deviation (Sample) | 12.9% | 15.0% |
| Standard Deviation (Population) | 12.8% | 14.7% |
Similar Demographics by Married-couple Households
Demographics Similar to Immigrants from Grenada by Married-couple Households
In terms of married-couple households, the demographic groups most similar to Immigrants from Grenada are Immigrants from Dominican Republic (37.3%, a difference of 0.43%), Tohono O'odham (37.9%, a difference of 1.1%), Cape Verdean (38.1%, a difference of 1.7%), Dominican (38.2%, a difference of 1.8%), and British West Indian (38.3%, a difference of 2.2%).
| Demographics | Rating | Rank | Married-couple Households |
| Immigrants | West Indies | 0.0 /100 | #333 | Tragic 39.0% |
| Immigrants | St. Vincent and the Grenadines | 0.0 /100 | #334 | Tragic 38.7% |
| Senegalese | 0.0 /100 | #335 | Tragic 38.6% |
| Blacks/African Americans | 0.0 /100 | #336 | Tragic 38.5% |
| Immigrants | Somalia | 0.0 /100 | #337 | Tragic 38.4% |
| Immigrants | Senegal | 0.0 /100 | #338 | Tragic 38.4% |
| British West Indians | 0.0 /100 | #339 | Tragic 38.3% |
| Dominicans | 0.0 /100 | #340 | Tragic 38.2% |
| Cape Verdeans | 0.0 /100 | #341 | Tragic 38.1% |
| Tohono O'odham | 0.0 /100 | #342 | Tragic 37.9% |
| Immigrants | Grenada | 0.0 /100 | #343 | Tragic 37.5% |
| Immigrants | Dominican Republic | 0.0 /100 | #344 | Tragic 37.3% |
| Hopi | 0.0 /100 | #345 | Tragic 36.7% |
| Immigrants | Cabo Verde | 0.0 /100 | #346 | Tragic 36.2% |
| Pima | 0.0 /100 | #347 | Tragic 35.6% |
Demographics Similar to Alsatians by Married-couple Households
In terms of married-couple households, the demographic groups most similar to Alsatians are Dutch West Indian (44.9%, a difference of 0.10%), Immigrants from Micronesia (44.9%, a difference of 0.12%), Immigrants from Cambodia (44.9%, a difference of 0.14%), Salvadoran (44.7%, a difference of 0.19%), and Kenyan (44.7%, a difference of 0.32%).
| Demographics | Rating | Rank | Married-couple Households |
| Nicaraguans | 5.3 /100 | #219 | Tragic 45.2% |
| Immigrants | Thailand | 5.1 /100 | #220 | Tragic 45.2% |
| Tlingit-Haida | 4.9 /100 | #221 | Tragic 45.1% |
| Immigrants | Laos | 4.6 /100 | #222 | Tragic 45.1% |
| Immigrants | Cambodia | 2.7 /100 | #223 | Tragic 44.9% |
| Immigrants | Micronesia | 2.6 /100 | #224 | Tragic 44.9% |
| Dutch West Indians | 2.6 /100 | #225 | Tragic 44.9% |
| Alsatians | 2.3 /100 | #226 | Tragic 44.8% |
| Salvadorans | 1.9 /100 | #227 | Tragic 44.7% |
| Kenyans | 1.7 /100 | #228 | Tragic 44.7% |
| Immigrants | Latin America | 1.6 /100 | #229 | Tragic 44.7% |
| Soviet Union | 1.6 /100 | #230 | Tragic 44.6% |
| Houma | 1.5 /100 | #231 | Tragic 44.6% |
| Marshallese | 1.5 /100 | #232 | Tragic 44.6% |
| Immigrants | Uganda | 1.5 /100 | #233 | Tragic 44.6% |