Immigrants from Egypt vs Scotch-Irish Single Father Households
COMPARE
Immigrants from Egypt
Scotch-Irish
Single Father Households
Single Father Households Comparison
Immigrants from Egypt
Scotch-Irish
2.1%
SINGLE FATHER HOUSEHOLDS
99.8/ 100
METRIC RATING
74th/ 347
METRIC RANK
2.3%
SINGLE FATHER HOUSEHOLDS
69.4/ 100
METRIC RATING
165th/ 347
METRIC RANK
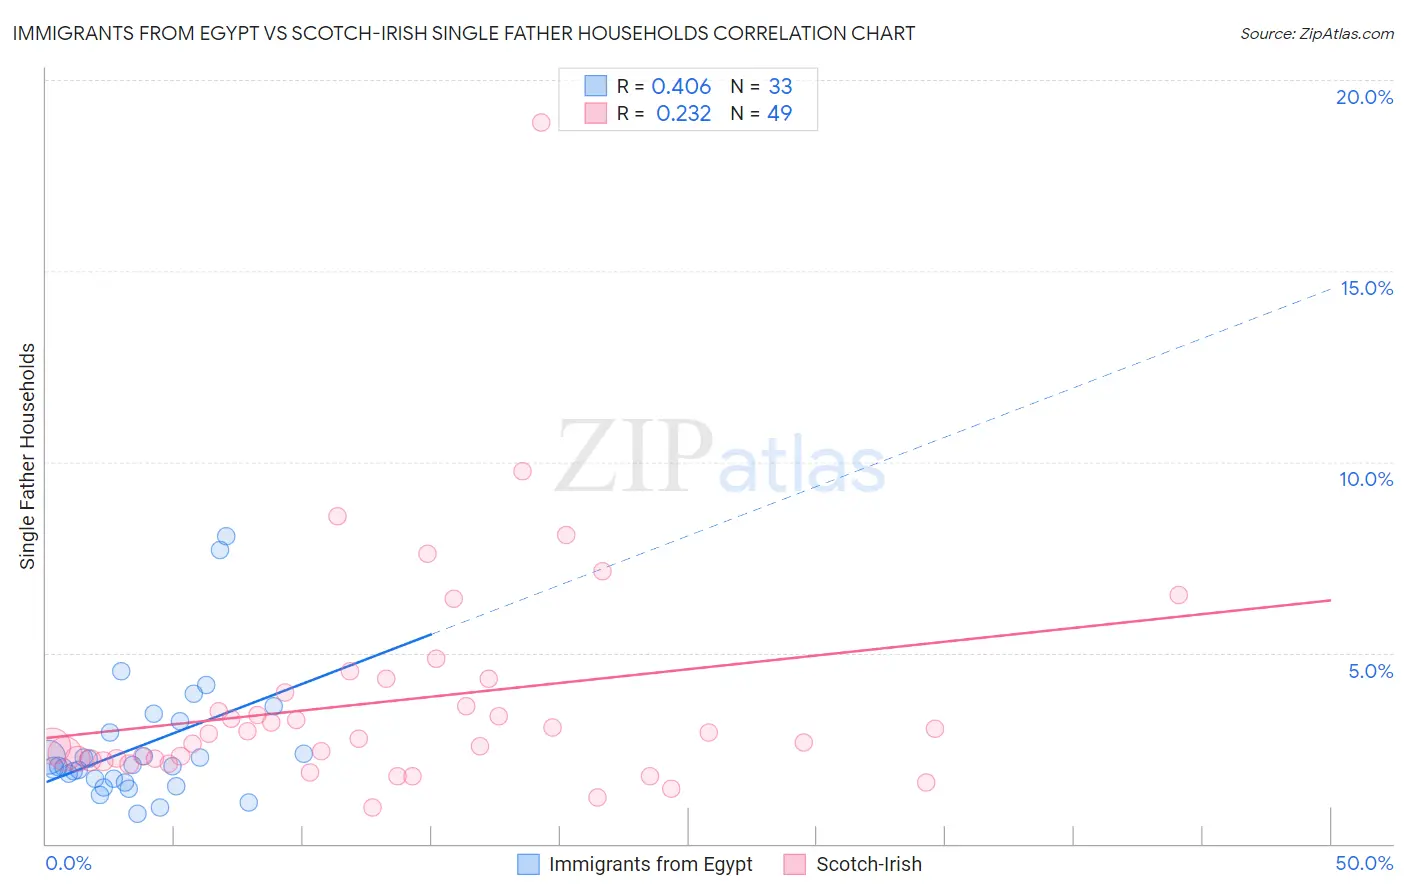
Immigrants from Egypt vs Scotch-Irish Single Father Households Correlation Chart
The statistical analysis conducted on geographies consisting of 244,264,821 people shows a moderate positive correlation between the proportion of Immigrants from Egypt and percentage of single father households in the United States with a correlation coefficient (R) of 0.406 and weighted average of 2.1%. Similarly, the statistical analysis conducted on geographies consisting of 535,957,408 people shows a weak positive correlation between the proportion of Scotch-Irish and percentage of single father households in the United States with a correlation coefficient (R) of 0.232 and weighted average of 2.3%, a difference of 11.2%.
Single Father Households Correlation Summary
| Measurement | Immigrants from Egypt | Scotch-Irish |
| Minimum | 0.78% | 0.96% |
| Maximum | 8.1% | 18.9% |
| Range | 7.3% | 17.9% |
| Mean | 2.6% | 3.7% |
| Median | 2.0% | 2.9% |
| Interquartile 25% (IQ1) | 1.7% | 2.2% |
| Interquartile 75% (IQ3) | 3.1% | 4.1% |
| Interquartile Range (IQR) | 1.4% | 1.9% |
| Standard Deviation (Sample) | 1.6% | 3.0% |
| Standard Deviation (Population) | 1.6% | 3.0% |
Similar Demographics by Single Father Households
Demographics Similar to Immigrants from Egypt by Single Father Households
In terms of single father households, the demographic groups most similar to Immigrants from Egypt are Immigrants from Bangladesh (2.1%, a difference of 0.0%), Immigrants from Kuwait (2.1%, a difference of 0.15%), Immigrants from Spain (2.1%, a difference of 0.15%), Egyptian (2.1%, a difference of 0.16%), and Immigrants from Sweden (2.1%, a difference of 0.28%).
| Demographics | Rating | Rank | Single Father Households |
| Immigrants | Italy | 99.8 /100 | #67 | Exceptional 2.1% |
| Immigrants | Denmark | 99.8 /100 | #68 | Exceptional 2.1% |
| Immigrants | Romania | 99.8 /100 | #69 | Exceptional 2.1% |
| Egyptians | 99.8 /100 | #70 | Exceptional 2.1% |
| Immigrants | Kuwait | 99.8 /100 | #71 | Exceptional 2.1% |
| Immigrants | Spain | 99.8 /100 | #72 | Exceptional 2.1% |
| Immigrants | Bangladesh | 99.8 /100 | #73 | Exceptional 2.1% |
| Immigrants | Egypt | 99.8 /100 | #74 | Exceptional 2.1% |
| Immigrants | Sweden | 99.8 /100 | #75 | Exceptional 2.1% |
| Immigrants | Scotland | 99.8 /100 | #76 | Exceptional 2.1% |
| Immigrants | Saudi Arabia | 99.8 /100 | #77 | Exceptional 2.1% |
| Estonians | 99.7 /100 | #78 | Exceptional 2.1% |
| Immigrants | Asia | 99.7 /100 | #79 | Exceptional 2.1% |
| Immigrants | South Africa | 99.7 /100 | #80 | Exceptional 2.1% |
| Armenians | 99.7 /100 | #81 | Exceptional 2.1% |
Demographics Similar to Scotch-Irish by Single Father Households
In terms of single father households, the demographic groups most similar to Scotch-Irish are English (2.3%, a difference of 0.070%), Pakistani (2.3%, a difference of 0.10%), Irish (2.3%, a difference of 0.24%), Scottish (2.3%, a difference of 0.31%), and Swiss (2.3%, a difference of 0.35%).
| Demographics | Rating | Rank | Single Father Households |
| Immigrants | Senegal | 79.4 /100 | #158 | Good 2.3% |
| Immigrants | West Indies | 77.9 /100 | #159 | Good 2.3% |
| Immigrants | Bolivia | 76.3 /100 | #160 | Good 2.3% |
| Swiss | 73.2 /100 | #161 | Good 2.3% |
| Scottish | 72.8 /100 | #162 | Good 2.3% |
| Irish | 72.1 /100 | #163 | Good 2.3% |
| Pakistanis | 70.6 /100 | #164 | Good 2.3% |
| Scotch-Irish | 69.4 /100 | #165 | Good 2.3% |
| English | 68.6 /100 | #166 | Good 2.3% |
| South Americans | 64.3 /100 | #167 | Good 2.3% |
| Icelanders | 63.1 /100 | #168 | Good 2.3% |
| Czechs | 62.5 /100 | #169 | Good 2.3% |
| Ugandans | 62.2 /100 | #170 | Good 2.3% |
| Swedes | 61.6 /100 | #171 | Good 2.3% |
| Czechoslovakians | 58.9 /100 | #172 | Average 2.3% |