Immigrants from Egypt vs Immigrants from Sierra Leone Single Father Households
COMPARE
Immigrants from Egypt
Immigrants from Sierra Leone
Single Father Households
Single Father Households Comparison
Immigrants from Egypt
Immigrants from Sierra Leone
2.1%
SINGLE FATHER HOUSEHOLDS
99.8/ 100
METRIC RATING
74th/ 347
METRIC RANK
2.5%
SINGLE FATHER HOUSEHOLDS
5.8/ 100
METRIC RATING
238th/ 347
METRIC RANK
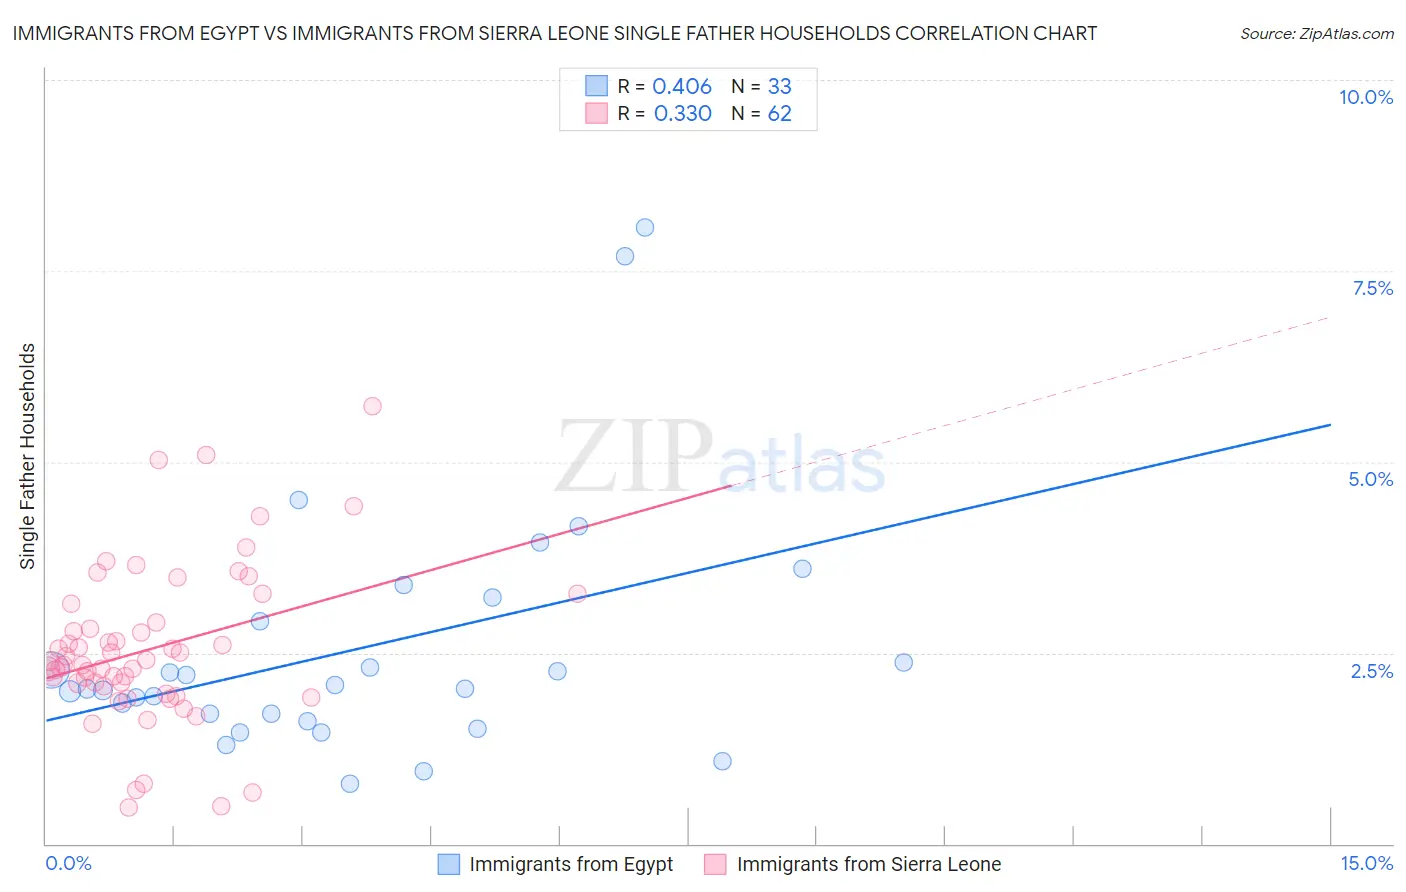
Immigrants from Egypt vs Immigrants from Sierra Leone Single Father Households Correlation Chart
The statistical analysis conducted on geographies consisting of 244,264,821 people shows a moderate positive correlation between the proportion of Immigrants from Egypt and percentage of single father households in the United States with a correlation coefficient (R) of 0.406 and weighted average of 2.1%. Similarly, the statistical analysis conducted on geographies consisting of 101,470,770 people shows a mild positive correlation between the proportion of Immigrants from Sierra Leone and percentage of single father households in the United States with a correlation coefficient (R) of 0.330 and weighted average of 2.5%, a difference of 18.7%.
Single Father Households Correlation Summary
| Measurement | Immigrants from Egypt | Immigrants from Sierra Leone |
| Minimum | 0.78% | 0.47% |
| Maximum | 8.1% | 5.7% |
| Range | 7.3% | 5.3% |
| Mean | 2.6% | 2.5% |
| Median | 2.0% | 2.4% |
| Interquartile 25% (IQ1) | 1.7% | 2.1% |
| Interquartile 75% (IQ3) | 3.1% | 2.9% |
| Interquartile Range (IQR) | 1.4% | 0.83% |
| Standard Deviation (Sample) | 1.6% | 1.0% |
| Standard Deviation (Population) | 1.6% | 1.0% |
Similar Demographics by Single Father Households
Demographics Similar to Immigrants from Egypt by Single Father Households
In terms of single father households, the demographic groups most similar to Immigrants from Egypt are Immigrants from Bangladesh (2.1%, a difference of 0.0%), Immigrants from Kuwait (2.1%, a difference of 0.15%), Immigrants from Spain (2.1%, a difference of 0.15%), Egyptian (2.1%, a difference of 0.16%), and Immigrants from Sweden (2.1%, a difference of 0.28%).
| Demographics | Rating | Rank | Single Father Households |
| Immigrants | Italy | 99.8 /100 | #67 | Exceptional 2.1% |
| Immigrants | Denmark | 99.8 /100 | #68 | Exceptional 2.1% |
| Immigrants | Romania | 99.8 /100 | #69 | Exceptional 2.1% |
| Egyptians | 99.8 /100 | #70 | Exceptional 2.1% |
| Immigrants | Kuwait | 99.8 /100 | #71 | Exceptional 2.1% |
| Immigrants | Spain | 99.8 /100 | #72 | Exceptional 2.1% |
| Immigrants | Bangladesh | 99.8 /100 | #73 | Exceptional 2.1% |
| Immigrants | Egypt | 99.8 /100 | #74 | Exceptional 2.1% |
| Immigrants | Sweden | 99.8 /100 | #75 | Exceptional 2.1% |
| Immigrants | Scotland | 99.8 /100 | #76 | Exceptional 2.1% |
| Immigrants | Saudi Arabia | 99.8 /100 | #77 | Exceptional 2.1% |
| Estonians | 99.7 /100 | #78 | Exceptional 2.1% |
| Immigrants | Asia | 99.7 /100 | #79 | Exceptional 2.1% |
| Immigrants | South Africa | 99.7 /100 | #80 | Exceptional 2.1% |
| Armenians | 99.7 /100 | #81 | Exceptional 2.1% |
Demographics Similar to Immigrants from Sierra Leone by Single Father Households
In terms of single father households, the demographic groups most similar to Immigrants from Sierra Leone are Immigrants from Oceania (2.5%, a difference of 0.010%), Sierra Leonean (2.5%, a difference of 0.030%), Cajun (2.5%, a difference of 0.080%), Immigrants (2.5%, a difference of 0.13%), and African (2.5%, a difference of 0.15%).
| Demographics | Rating | Rank | Single Father Households |
| Immigrants | Nonimmigrants | 7.6 /100 | #231 | Tragic 2.4% |
| Pennsylvania Germans | 7.3 /100 | #232 | Tragic 2.4% |
| Immigrants | Western Africa | 7.0 /100 | #233 | Tragic 2.4% |
| Africans | 6.3 /100 | #234 | Tragic 2.5% |
| Immigrants | Immigrants | 6.3 /100 | #235 | Tragic 2.5% |
| Cajuns | 6.1 /100 | #236 | Tragic 2.5% |
| Sierra Leoneans | 5.9 /100 | #237 | Tragic 2.5% |
| Immigrants | Sierra Leone | 5.8 /100 | #238 | Tragic 2.5% |
| Immigrants | Oceania | 5.8 /100 | #239 | Tragic 2.5% |
| Immigrants | Dominica | 4.8 /100 | #240 | Tragic 2.5% |
| Portuguese | 4.1 /100 | #241 | Tragic 2.5% |
| Osage | 4.1 /100 | #242 | Tragic 2.5% |
| Spaniards | 3.1 /100 | #243 | Tragic 2.5% |
| Immigrants | Middle Africa | 2.8 /100 | #244 | Tragic 2.5% |
| Basques | 2.5 /100 | #245 | Tragic 2.5% |