Immigrants from Eastern Africa vs Filipino Family Households
COMPARE
Immigrants from Eastern Africa
Filipino
Family Households
Family Households Comparison
Immigrants from Eastern Africa
Filipinos
61.1%
FAMILY HOUSEHOLDS
0.0/ 100
METRIC RATING
334th/ 347
METRIC RANK
65.9%
FAMILY HOUSEHOLDS
99.9/ 100
METRIC RATING
67th/ 347
METRIC RANK
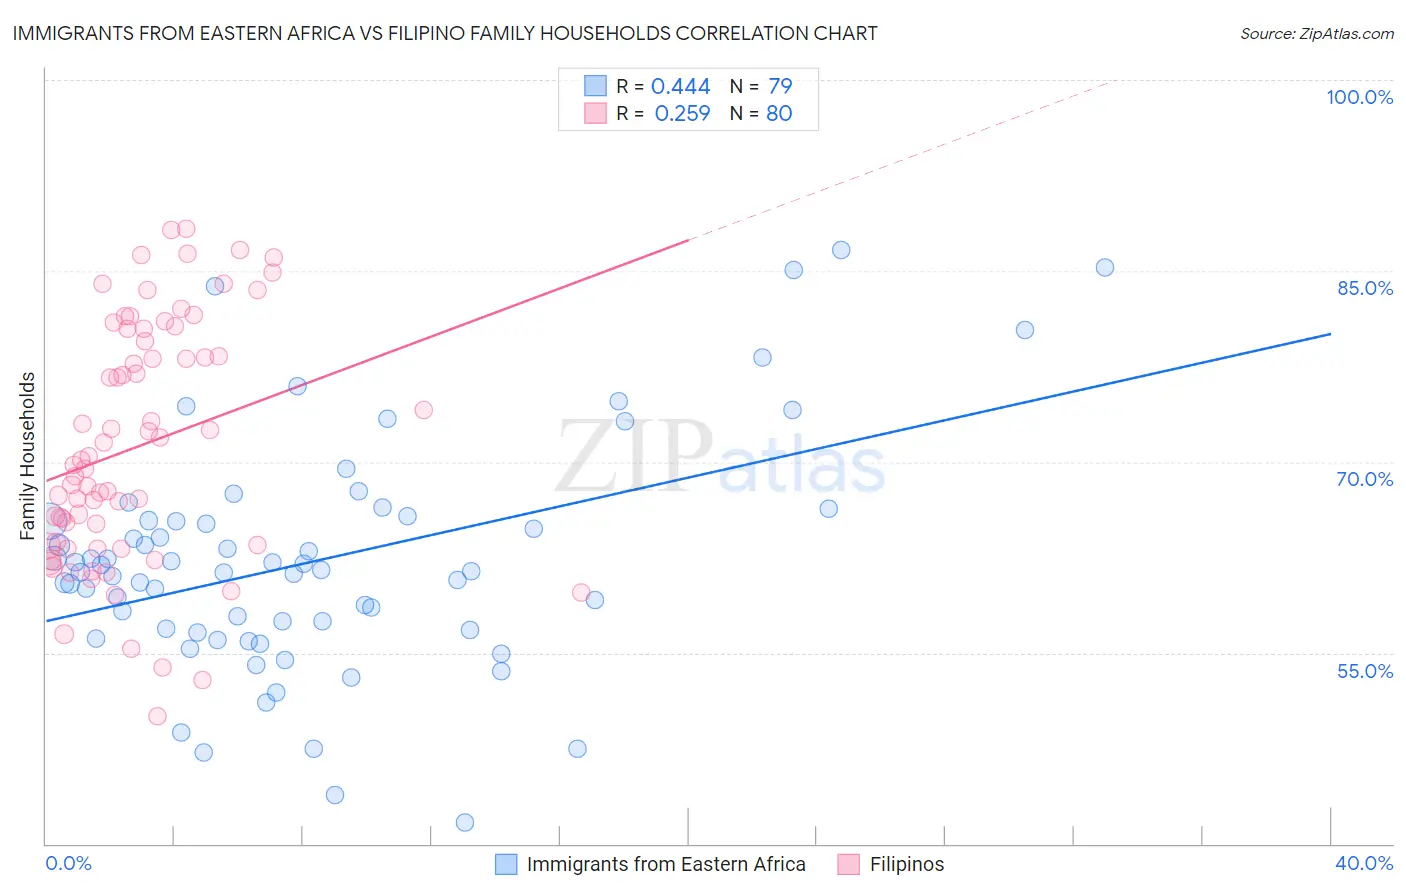
Immigrants from Eastern Africa vs Filipino Family Households Correlation Chart
The statistical analysis conducted on geographies consisting of 354,874,836 people shows a moderate positive correlation between the proportion of Immigrants from Eastern Africa and percentage of family households in the United States with a correlation coefficient (R) of 0.444 and weighted average of 61.1%. Similarly, the statistical analysis conducted on geographies consisting of 254,177,261 people shows a weak positive correlation between the proportion of Filipinos and percentage of family households in the United States with a correlation coefficient (R) of 0.259 and weighted average of 65.9%, a difference of 7.8%.
Family Households Correlation Summary
| Measurement | Immigrants from Eastern Africa | Filipino |
| Minimum | 41.7% | 50.0% |
| Maximum | 86.7% | 88.3% |
| Range | 45.0% | 38.3% |
| Mean | 62.2% | 71.2% |
| Median | 61.4% | 69.9% |
| Interquartile 25% (IQ1) | 56.8% | 63.5% |
| Interquartile 75% (IQ3) | 65.4% | 80.0% |
| Interquartile Range (IQR) | 8.6% | 16.5% |
| Standard Deviation (Sample) | 9.1% | 9.4% |
| Standard Deviation (Population) | 9.0% | 9.4% |
Similar Demographics by Family Households
Demographics Similar to Immigrants from Eastern Africa by Family Households
In terms of family households, the demographic groups most similar to Immigrants from Eastern Africa are Immigrants from Ethiopia (61.2%, a difference of 0.080%), Carpatho Rusyn (61.1%, a difference of 0.12%), Ethiopian (61.2%, a difference of 0.16%), Immigrants from Australia (61.3%, a difference of 0.24%), and Immigrants from France (61.3%, a difference of 0.24%).
| Demographics | Rating | Rank | Family Households |
| Blacks/African Americans | 0.0 /100 | #327 | Tragic 61.5% |
| Kiowa | 0.0 /100 | #328 | Tragic 61.4% |
| Cambodians | 0.0 /100 | #329 | Tragic 61.4% |
| Immigrants | Australia | 0.0 /100 | #330 | Tragic 61.3% |
| Immigrants | France | 0.0 /100 | #331 | Tragic 61.3% |
| Ethiopians | 0.0 /100 | #332 | Tragic 61.2% |
| Immigrants | Ethiopia | 0.0 /100 | #333 | Tragic 61.2% |
| Immigrants | Eastern Africa | 0.0 /100 | #334 | Tragic 61.1% |
| Carpatho Rusyns | 0.0 /100 | #335 | Tragic 61.1% |
| German Russians | 0.0 /100 | #336 | Tragic 60.9% |
| Soviet Union | 0.0 /100 | #337 | Tragic 60.9% |
| Immigrants | Eritrea | 0.0 /100 | #338 | Tragic 60.8% |
| Immigrants | Saudi Arabia | 0.0 /100 | #339 | Tragic 60.7% |
| Immigrants | Sudan | 0.0 /100 | #340 | Tragic 60.2% |
| Immigrants | Senegal | 0.0 /100 | #341 | Tragic 60.1% |
Demographics Similar to Filipinos by Family Households
In terms of family households, the demographic groups most similar to Filipinos are Fijian (65.9%, a difference of 0.0%), Japanese (65.9%, a difference of 0.020%), Costa Rican (65.9%, a difference of 0.040%), Pima (65.9%, a difference of 0.050%), and Malaysian (65.9%, a difference of 0.050%).
| Demographics | Rating | Rank | Family Households |
| South Americans | 100.0 /100 | #60 | Exceptional 66.0% |
| Danes | 100.0 /100 | #61 | Exceptional 66.0% |
| Central Americans | 100.0 /100 | #62 | Exceptional 66.0% |
| Immigrants | Indonesia | 100.0 /100 | #63 | Exceptional 66.0% |
| Pima | 99.9 /100 | #64 | Exceptional 65.9% |
| Costa Ricans | 99.9 /100 | #65 | Exceptional 65.9% |
| Fijians | 99.9 /100 | #66 | Exceptional 65.9% |
| Filipinos | 99.9 /100 | #67 | Exceptional 65.9% |
| Japanese | 99.9 /100 | #68 | Exceptional 65.9% |
| Malaysians | 99.9 /100 | #69 | Exceptional 65.9% |
| Immigrants | Afghanistan | 99.9 /100 | #70 | Exceptional 65.9% |
| Bhutanese | 99.9 /100 | #71 | Exceptional 65.9% |
| Portuguese | 99.9 /100 | #72 | Exceptional 65.8% |
| Laotians | 99.9 /100 | #73 | Exceptional 65.8% |
| Burmese | 99.9 /100 | #74 | Exceptional 65.7% |