Immigrants from Czechoslovakia vs Hmong Births to Unmarried Women
COMPARE
Immigrants from Czechoslovakia
Hmong
Births to Unmarried Women
Births to Unmarried Women Comparison
Immigrants from Czechoslovakia
Hmong
28.4%
BIRTHS TO UNMARRIED WOMEN
98.8/ 100
METRIC RATING
65th/ 347
METRIC RANK
27.7%
BIRTHS TO UNMARRIED WOMEN
99.5/ 100
METRIC RATING
47th/ 347
METRIC RANK
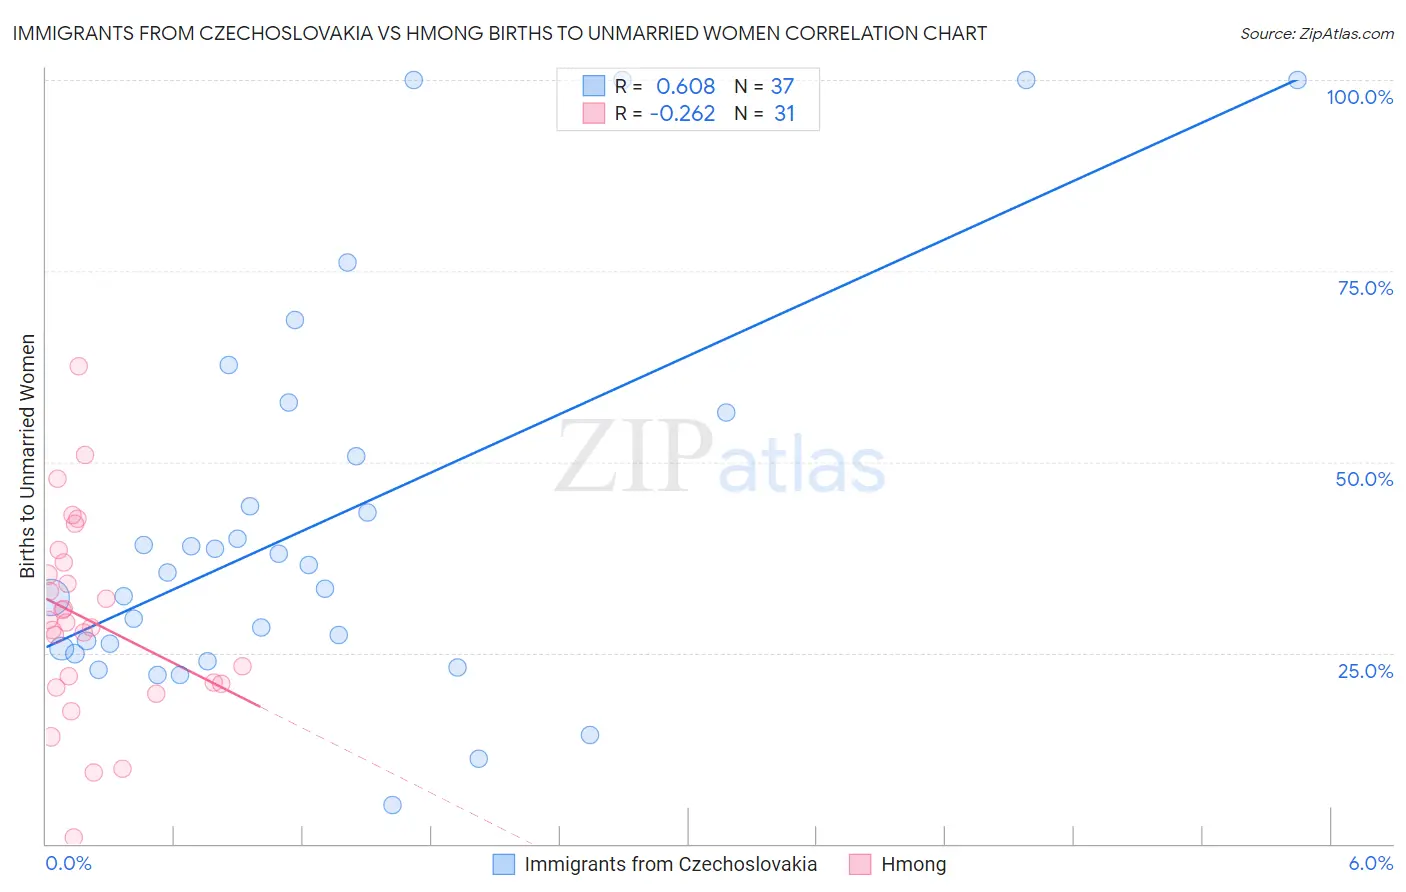
Immigrants from Czechoslovakia vs Hmong Births to Unmarried Women Correlation Chart
The statistical analysis conducted on geographies consisting of 184,731,208 people shows a significant positive correlation between the proportion of Immigrants from Czechoslovakia and percentage of births to unmarried women in the United States with a correlation coefficient (R) of 0.608 and weighted average of 28.4%. Similarly, the statistical analysis conducted on geographies consisting of 24,592,698 people shows a weak negative correlation between the proportion of Hmong and percentage of births to unmarried women in the United States with a correlation coefficient (R) of -0.262 and weighted average of 27.7%, a difference of 2.4%.
Births to Unmarried Women Correlation Summary
| Measurement | Immigrants from Czechoslovakia | Hmong |
| Minimum | 5.1% | 0.90% |
| Maximum | 100.0% | 62.6% |
| Range | 94.9% | 61.7% |
| Mean | 42.1% | 29.3% |
| Median | 35.5% | 29.0% |
| Interquartile 25% (IQ1) | 25.2% | 21.0% |
| Interquartile 75% (IQ3) | 53.6% | 36.9% |
| Interquartile Range (IQR) | 28.5% | 15.9% |
| Standard Deviation (Sample) | 25.4% | 13.0% |
| Standard Deviation (Population) | 25.1% | 12.7% |
Demographics Similar to Immigrants from Czechoslovakia and Hmong by Births to Unmarried Women
In terms of births to unmarried women, the demographic groups most similar to Immigrants from Czechoslovakia are Tongan (28.4%, a difference of 0.020%), Immigrants from Egypt (28.4%, a difference of 0.020%), Immigrants from Serbia (28.3%, a difference of 0.40%), Egyptian (28.2%, a difference of 0.54%), and Immigrants from North Macedonia (28.1%, a difference of 0.87%). Similarly, the demographic groups most similar to Hmong are Immigrants from Lithuania (27.7%, a difference of 0.0%), Eastern European (27.7%, a difference of 0.010%), Immigrants from Greece (27.8%, a difference of 0.20%), Maltese (27.8%, a difference of 0.32%), and Macedonian (27.9%, a difference of 0.46%).
| Demographics | Rating | Rank | Births to Unmarried Women |
| Immigrants | Lithuania | 99.5 /100 | #46 | Exceptional 27.7% |
| Hmong | 99.5 /100 | #47 | Exceptional 27.7% |
| Eastern Europeans | 99.5 /100 | #48 | Exceptional 27.7% |
| Immigrants | Greece | 99.4 /100 | #49 | Exceptional 27.8% |
| Maltese | 99.4 /100 | #50 | Exceptional 27.8% |
| Macedonians | 99.4 /100 | #51 | Exceptional 27.9% |
| Bhutanese | 99.4 /100 | #52 | Exceptional 27.9% |
| Immigrants | Romania | 99.4 /100 | #53 | Exceptional 27.9% |
| Afghans | 99.4 /100 | #54 | Exceptional 27.9% |
| Mongolians | 99.3 /100 | #55 | Exceptional 27.9% |
| Immigrants | Belgium | 99.3 /100 | #56 | Exceptional 28.0% |
| Russians | 99.2 /100 | #57 | Exceptional 28.0% |
| Immigrants | Albania | 99.2 /100 | #58 | Exceptional 28.0% |
| Immigrants | Kazakhstan | 99.1 /100 | #59 | Exceptional 28.1% |
| Immigrants | Turkey | 99.1 /100 | #60 | Exceptional 28.1% |
| Immigrants | North Macedonia | 99.1 /100 | #61 | Exceptional 28.1% |
| Egyptians | 99.0 /100 | #62 | Exceptional 28.2% |
| Immigrants | Serbia | 98.9 /100 | #63 | Exceptional 28.3% |
| Tongans | 98.8 /100 | #64 | Exceptional 28.4% |
| Immigrants | Czechoslovakia | 98.8 /100 | #65 | Exceptional 28.4% |
| Immigrants | Egypt | 98.8 /100 | #66 | Exceptional 28.4% |