Immigrants from Belarus vs Immigrants from India Married-couple Households
COMPARE
Immigrants from Belarus
Immigrants from India
Married-couple Households
Married-couple Households Comparison
Immigrants from Belarus
Immigrants from India
47.2%
MARRIED-COUPLE HOUSEHOLDS
83.8/ 100
METRIC RATING
143rd/ 347
METRIC RANK
52.7%
MARRIED-COUPLE HOUSEHOLDS
100.0/ 100
METRIC RATING
1st/ 347
METRIC RANK
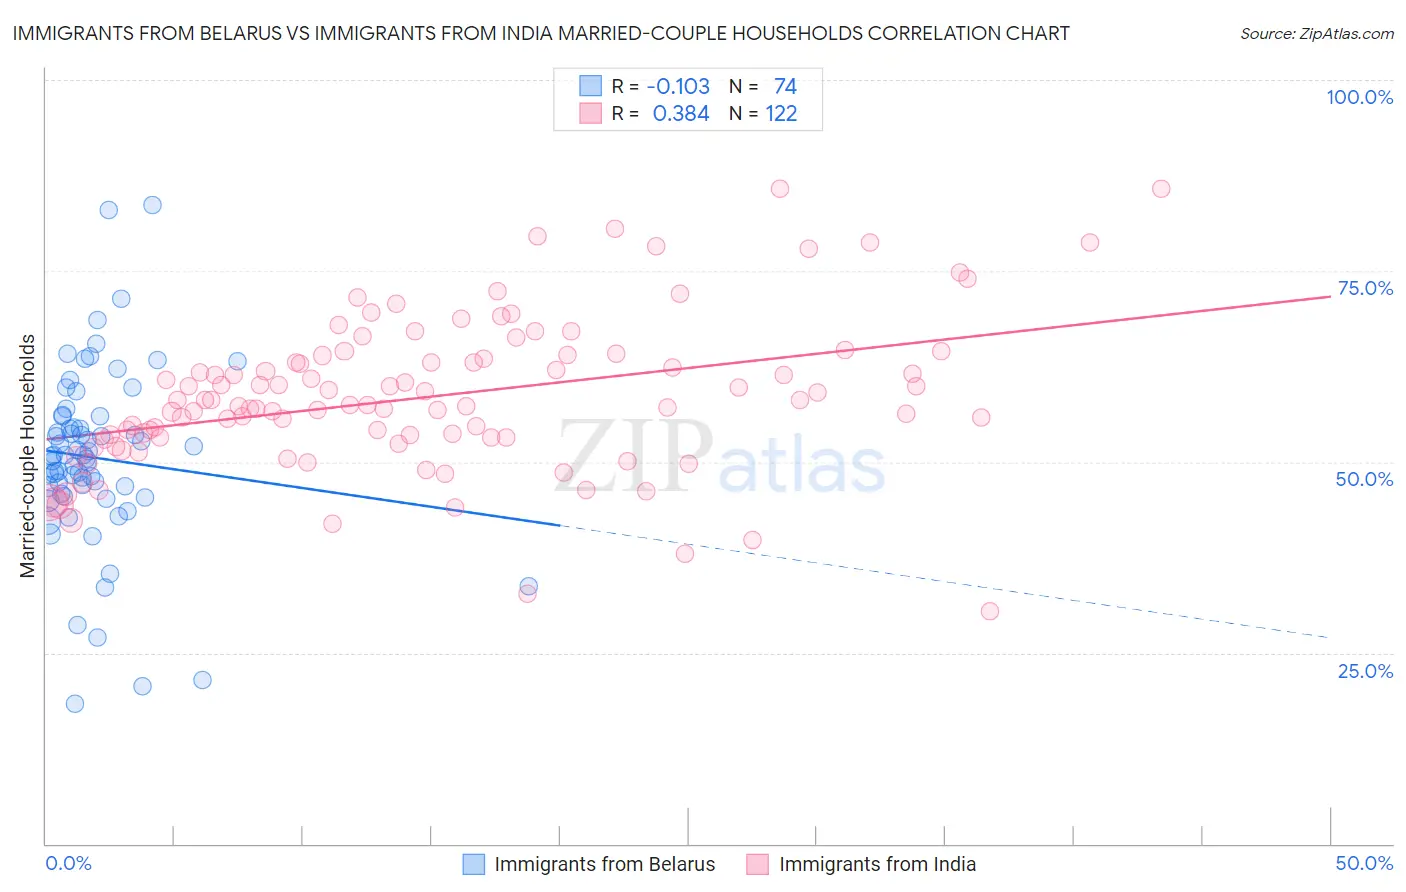
Immigrants from Belarus vs Immigrants from India Married-couple Households Correlation Chart
The statistical analysis conducted on geographies consisting of 150,189,140 people shows a poor negative correlation between the proportion of Immigrants from Belarus and percentage of married-couple family households in the United States with a correlation coefficient (R) of -0.103 and weighted average of 47.2%. Similarly, the statistical analysis conducted on geographies consisting of 433,740,567 people shows a mild positive correlation between the proportion of Immigrants from India and percentage of married-couple family households in the United States with a correlation coefficient (R) of 0.384 and weighted average of 52.7%, a difference of 11.8%.
Married-couple Households Correlation Summary
| Measurement | Immigrants from Belarus | Immigrants from India |
| Minimum | 18.4% | 30.4% |
| Maximum | 83.7% | 85.7% |
| Range | 65.3% | 55.3% |
| Mean | 50.5% | 58.5% |
| Median | 50.8% | 57.4% |
| Interquartile 25% (IQ1) | 45.9% | 53.2% |
| Interquartile 75% (IQ3) | 55.9% | 63.5% |
| Interquartile Range (IQR) | 10.0% | 10.3% |
| Standard Deviation (Sample) | 11.7% | 10.0% |
| Standard Deviation (Population) | 11.6% | 10.0% |
Similar Demographics by Married-couple Households
Demographics Similar to Immigrants from Belarus by Married-couple Households
In terms of married-couple households, the demographic groups most similar to Immigrants from Belarus are Spaniard (47.2%, a difference of 0.020%), Mexican (47.1%, a difference of 0.020%), Costa Rican (47.2%, a difference of 0.040%), Spanish (47.2%, a difference of 0.050%), and Immigrants from Sweden (47.2%, a difference of 0.060%).
| Demographics | Rating | Rank | Married-couple Households |
| New Zealanders | 85.3 /100 | #136 | Excellent 47.2% |
| Immigrants | Malaysia | 85.2 /100 | #137 | Excellent 47.2% |
| Immigrants | Afghanistan | 85.1 /100 | #138 | Excellent 47.2% |
| Immigrants | Sweden | 84.7 /100 | #139 | Excellent 47.2% |
| Spanish | 84.5 /100 | #140 | Excellent 47.2% |
| Costa Ricans | 84.4 /100 | #141 | Excellent 47.2% |
| Spaniards | 84.1 /100 | #142 | Excellent 47.2% |
| Immigrants | Belarus | 83.8 /100 | #143 | Excellent 47.2% |
| Mexicans | 83.4 /100 | #144 | Excellent 47.1% |
| Slovenes | 81.7 /100 | #145 | Excellent 47.1% |
| Immigrants | Western Europe | 81.6 /100 | #146 | Excellent 47.1% |
| Immigrants | Syria | 81.6 /100 | #147 | Excellent 47.1% |
| Icelanders | 79.5 /100 | #148 | Good 47.0% |
| Paraguayans | 78.7 /100 | #149 | Good 47.0% |
| Immigrants | Russia | 77.6 /100 | #150 | Good 47.0% |
Demographics Similar to Immigrants from India by Married-couple Households
In terms of married-couple households, the demographic groups most similar to Immigrants from India are Immigrants from Taiwan (52.4%, a difference of 0.61%), Thai (51.9%, a difference of 1.6%), Assyrian/Chaldean/Syriac (51.8%, a difference of 1.8%), Tongan (51.6%, a difference of 2.3%), and Danish (51.1%, a difference of 3.3%).
| Demographics | Rating | Rank | Married-couple Households |
| Immigrants | India | 100.0 /100 | #1 | Exceptional 52.7% |
| Immigrants | Taiwan | 100.0 /100 | #2 | Exceptional 52.4% |
| Thais | 100.0 /100 | #3 | Exceptional 51.9% |
| Assyrians/Chaldeans/Syriacs | 100.0 /100 | #4 | Exceptional 51.8% |
| Tongans | 100.0 /100 | #5 | Exceptional 51.6% |
| Danes | 100.0 /100 | #6 | Exceptional 51.1% |
| Filipinos | 100.0 /100 | #7 | Exceptional 51.0% |
| Immigrants | South Central Asia | 100.0 /100 | #8 | Exceptional 50.6% |
| Pennsylvania Germans | 100.0 /100 | #9 | Exceptional 50.4% |
| Chinese | 100.0 /100 | #10 | Exceptional 50.4% |
| Immigrants | Pakistan | 100.0 /100 | #11 | Exceptional 50.1% |
| Swiss | 100.0 /100 | #12 | Exceptional 49.9% |
| Immigrants | Korea | 100.0 /100 | #13 | Exceptional 49.9% |
| Burmese | 100.0 /100 | #14 | Exceptional 49.8% |
| Koreans | 99.9 /100 | #15 | Exceptional 49.7% |