Immigrants from Australia vs Moroccan Family Households with Children
COMPARE
Immigrants from Australia
Moroccan
Family Households with Children
Family Households with Children Comparison
Immigrants from Australia
Moroccans
26.0%
FAMILY HOUSEHOLDS WITH CHILDREN
0.0/ 100
METRIC RATING
323rd/ 347
METRIC RANK
26.9%
FAMILY HOUSEHOLDS WITH CHILDREN
3.4/ 100
METRIC RATING
238th/ 347
METRIC RANK
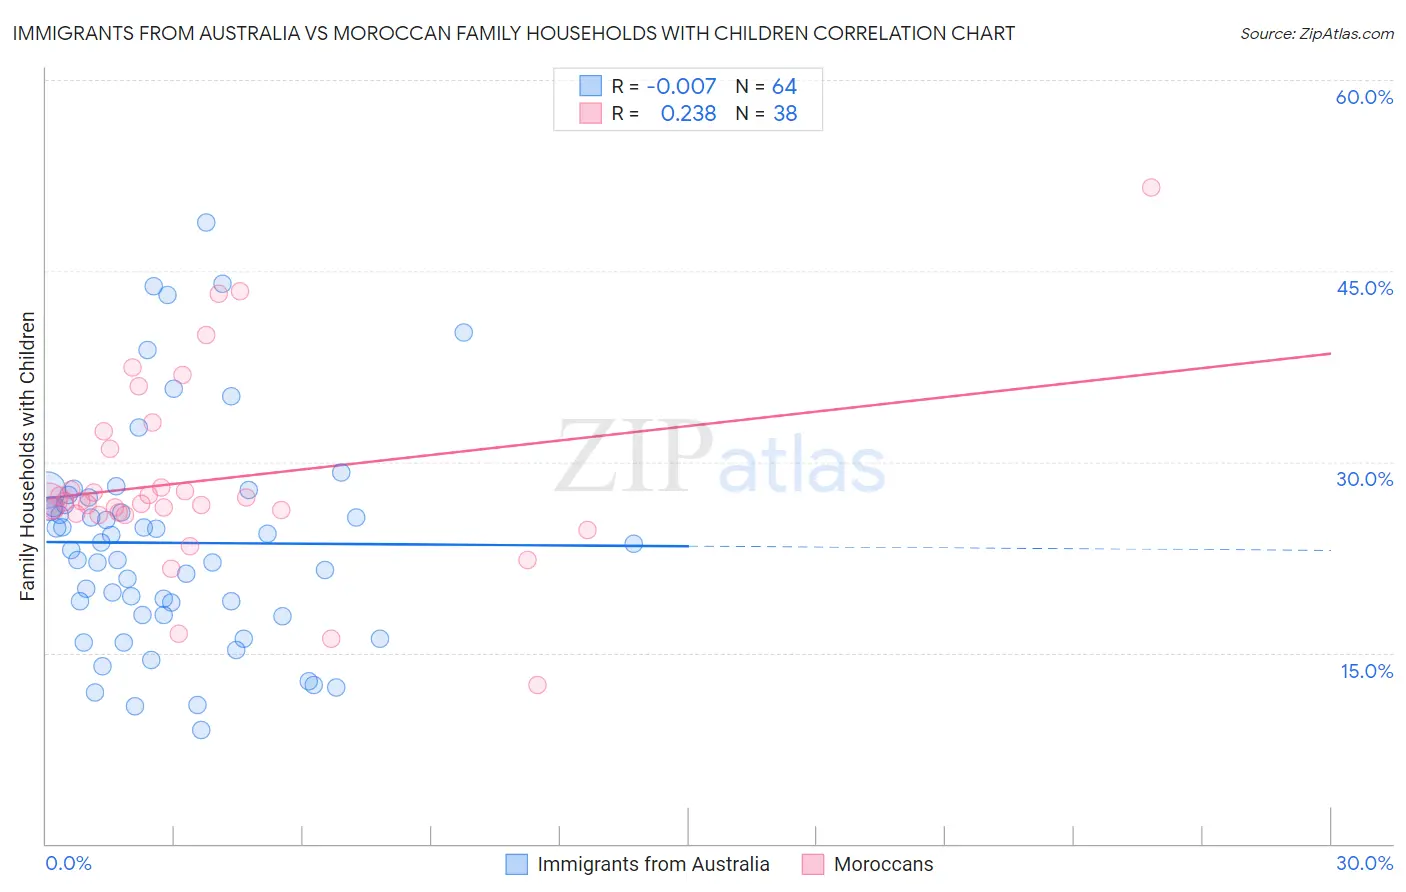
Immigrants from Australia vs Moroccan Family Households with Children Correlation Chart
The statistical analysis conducted on geographies consisting of 227,064,474 people shows no correlation between the proportion of Immigrants from Australia and percentage of family households with children in the United States with a correlation coefficient (R) of -0.007 and weighted average of 26.0%. Similarly, the statistical analysis conducted on geographies consisting of 201,690,181 people shows a weak positive correlation between the proportion of Moroccans and percentage of family households with children in the United States with a correlation coefficient (R) of 0.238 and weighted average of 26.9%, a difference of 3.6%.
Family Households with Children Correlation Summary
| Measurement | Immigrants from Australia | Moroccan |
| Minimum | 9.0% | 12.4% |
| Maximum | 48.8% | 51.6% |
| Range | 39.8% | 39.1% |
| Mean | 23.6% | 28.5% |
| Median | 23.3% | 26.9% |
| Interquartile 25% (IQ1) | 18.0% | 25.9% |
| Interquartile 75% (IQ3) | 26.9% | 31.0% |
| Interquartile Range (IQR) | 8.9% | 5.1% |
| Standard Deviation (Sample) | 8.6% | 7.5% |
| Standard Deviation (Population) | 8.5% | 7.4% |
Similar Demographics by Family Households with Children
Demographics Similar to Immigrants from Australia by Family Households with Children
In terms of family households with children, the demographic groups most similar to Immigrants from Australia are Immigrants from Greece (26.0%, a difference of 0.030%), Chinese (26.0%, a difference of 0.030%), British West Indian (26.0%, a difference of 0.040%), Tlingit-Haida (26.0%, a difference of 0.060%), and Immigrants from France (26.0%, a difference of 0.070%).
| Demographics | Rating | Rank | Family Households with Children |
| Estonians | 0.0 /100 | #316 | Tragic 26.1% |
| Ottawa | 0.0 /100 | #317 | Tragic 26.1% |
| Iroquois | 0.0 /100 | #318 | Tragic 26.1% |
| Immigrants | France | 0.0 /100 | #319 | Tragic 26.0% |
| Tlingit-Haida | 0.0 /100 | #320 | Tragic 26.0% |
| British West Indians | 0.0 /100 | #321 | Tragic 26.0% |
| Immigrants | Greece | 0.0 /100 | #322 | Tragic 26.0% |
| Immigrants | Australia | 0.0 /100 | #323 | Tragic 26.0% |
| Chinese | 0.0 /100 | #324 | Tragic 26.0% |
| Barbadians | 0.0 /100 | #325 | Tragic 26.0% |
| Immigrants | Ireland | 0.0 /100 | #326 | Tragic 26.0% |
| Immigrants | Barbados | 0.0 /100 | #327 | Tragic 26.0% |
| Immigrants | Albania | 0.0 /100 | #328 | Tragic 25.9% |
| Cypriots | 0.0 /100 | #329 | Tragic 25.9% |
| Immigrants | Latvia | 0.0 /100 | #330 | Tragic 25.9% |
Demographics Similar to Moroccans by Family Households with Children
In terms of family households with children, the demographic groups most similar to Moroccans are Immigrants from Netherlands (26.9%, a difference of 0.010%), Immigrants from Southern Europe (26.9%, a difference of 0.010%), Cape Verdean (26.9%, a difference of 0.020%), Immigrants from Bulgaria (26.9%, a difference of 0.020%), and Navajo (26.9%, a difference of 0.030%).
| Demographics | Rating | Rank | Family Households with Children |
| Luxembourgers | 5.5 /100 | #231 | Tragic 27.0% |
| Yugoslavians | 5.1 /100 | #232 | Tragic 27.0% |
| Immigrants | Italy | 5.0 /100 | #233 | Tragic 27.0% |
| Immigrants | Germany | 4.4 /100 | #234 | Tragic 27.0% |
| Immigrants | Morocco | 4.2 /100 | #235 | Tragic 27.0% |
| Cape Verdeans | 3.6 /100 | #236 | Tragic 26.9% |
| Immigrants | Netherlands | 3.5 /100 | #237 | Tragic 26.9% |
| Moroccans | 3.4 /100 | #238 | Tragic 26.9% |
| Immigrants | Southern Europe | 3.4 /100 | #239 | Tragic 26.9% |
| Immigrants | Bulgaria | 3.3 /100 | #240 | Tragic 26.9% |
| Navajo | 3.2 /100 | #241 | Tragic 26.9% |
| Immigrants | England | 3.2 /100 | #242 | Tragic 26.9% |
| Immigrants | Saudi Arabia | 2.9 /100 | #243 | Tragic 26.9% |
| Ukrainians | 2.9 /100 | #244 | Tragic 26.9% |
| Australians | 2.8 /100 | #245 | Tragic 26.9% |