Immigrants from Australia vs Dominican Family Households with Children
COMPARE
Immigrants from Australia
Dominican
Family Households with Children
Family Households with Children Comparison
Immigrants from Australia
Dominicans
26.0%
FAMILY HOUSEHOLDS WITH CHILDREN
0.0/ 100
METRIC RATING
323rd/ 347
METRIC RANK
27.5%
FAMILY HOUSEHOLDS WITH CHILDREN
61.1/ 100
METRIC RATING
167th/ 347
METRIC RANK
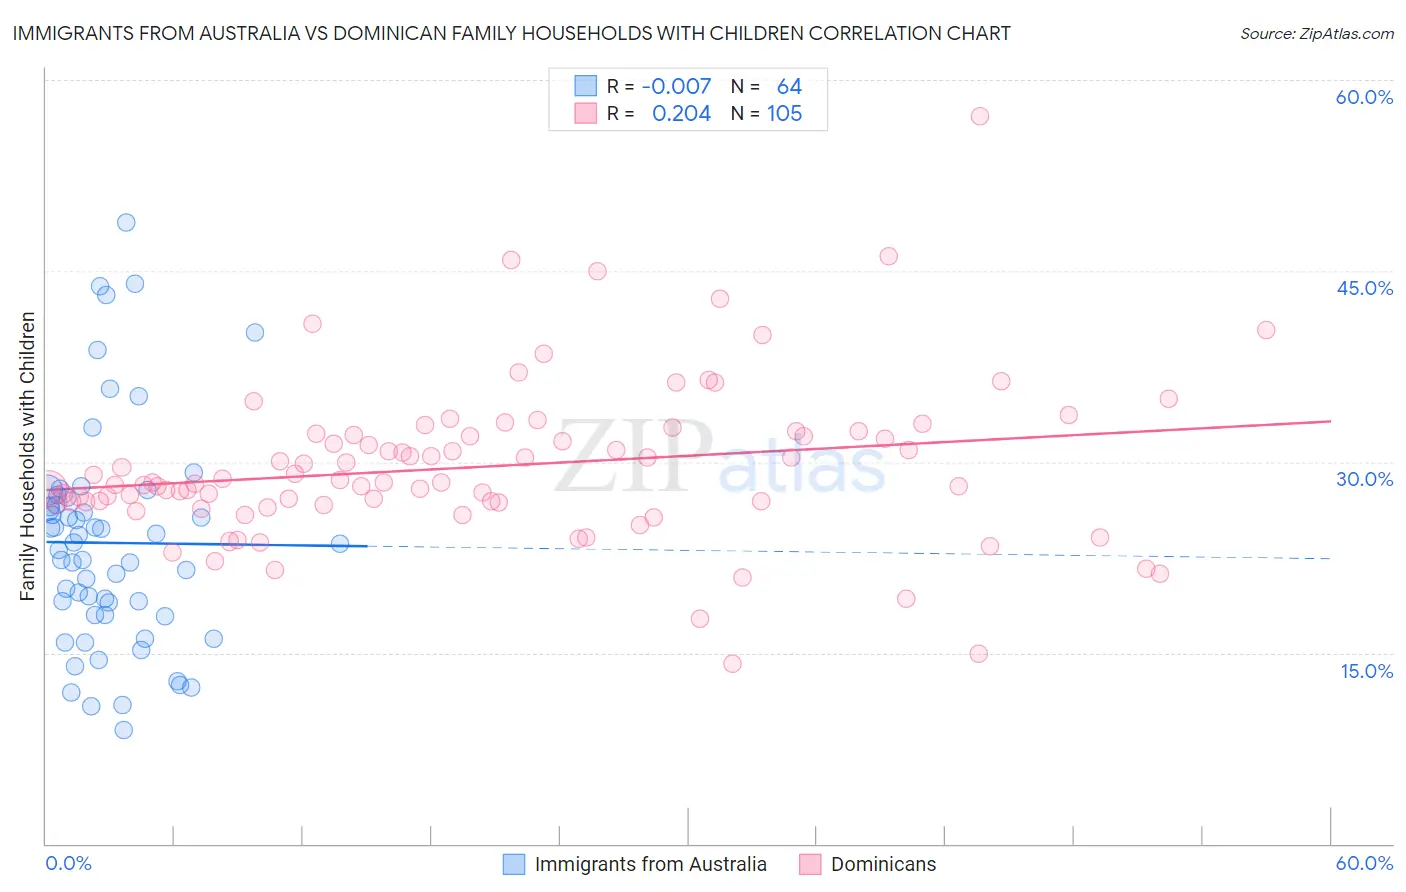
Immigrants from Australia vs Dominican Family Households with Children Correlation Chart
The statistical analysis conducted on geographies consisting of 227,064,474 people shows no correlation between the proportion of Immigrants from Australia and percentage of family households with children in the United States with a correlation coefficient (R) of -0.007 and weighted average of 26.0%. Similarly, the statistical analysis conducted on geographies consisting of 354,685,536 people shows a weak positive correlation between the proportion of Dominicans and percentage of family households with children in the United States with a correlation coefficient (R) of 0.204 and weighted average of 27.5%, a difference of 5.8%.
Family Households with Children Correlation Summary
| Measurement | Immigrants from Australia | Dominican |
| Minimum | 9.0% | 14.2% |
| Maximum | 48.8% | 57.1% |
| Range | 39.8% | 43.0% |
| Mean | 23.6% | 29.6% |
| Median | 23.3% | 28.4% |
| Interquartile 25% (IQ1) | 18.0% | 26.8% |
| Interquartile 75% (IQ3) | 26.9% | 32.2% |
| Interquartile Range (IQR) | 8.9% | 5.3% |
| Standard Deviation (Sample) | 8.6% | 6.3% |
| Standard Deviation (Population) | 8.5% | 6.3% |
Similar Demographics by Family Households with Children
Demographics Similar to Immigrants from Australia by Family Households with Children
In terms of family households with children, the demographic groups most similar to Immigrants from Australia are Immigrants from Greece (26.0%, a difference of 0.030%), Chinese (26.0%, a difference of 0.030%), British West Indian (26.0%, a difference of 0.040%), Tlingit-Haida (26.0%, a difference of 0.060%), and Immigrants from France (26.0%, a difference of 0.070%).
| Demographics | Rating | Rank | Family Households with Children |
| Estonians | 0.0 /100 | #316 | Tragic 26.1% |
| Ottawa | 0.0 /100 | #317 | Tragic 26.1% |
| Iroquois | 0.0 /100 | #318 | Tragic 26.1% |
| Immigrants | France | 0.0 /100 | #319 | Tragic 26.0% |
| Tlingit-Haida | 0.0 /100 | #320 | Tragic 26.0% |
| British West Indians | 0.0 /100 | #321 | Tragic 26.0% |
| Immigrants | Greece | 0.0 /100 | #322 | Tragic 26.0% |
| Immigrants | Australia | 0.0 /100 | #323 | Tragic 26.0% |
| Chinese | 0.0 /100 | #324 | Tragic 26.0% |
| Barbadians | 0.0 /100 | #325 | Tragic 26.0% |
| Immigrants | Ireland | 0.0 /100 | #326 | Tragic 26.0% |
| Immigrants | Barbados | 0.0 /100 | #327 | Tragic 26.0% |
| Immigrants | Albania | 0.0 /100 | #328 | Tragic 25.9% |
| Cypriots | 0.0 /100 | #329 | Tragic 25.9% |
| Immigrants | Latvia | 0.0 /100 | #330 | Tragic 25.9% |
Demographics Similar to Dominicans by Family Households with Children
In terms of family households with children, the demographic groups most similar to Dominicans are Immigrants from South Africa (27.5%, a difference of 0.0%), Nonimmigrants (27.5%, a difference of 0.0%), Immigrants from Kuwait (27.5%, a difference of 0.010%), Immigrants from Hong Kong (27.5%, a difference of 0.090%), and Czech (27.5%, a difference of 0.10%).
| Demographics | Rating | Rank | Family Households with Children |
| Sub-Saharan Africans | 67.5 /100 | #160 | Good 27.6% |
| Alaskan Athabascans | 67.1 /100 | #161 | Good 27.6% |
| Immigrants | Bangladesh | 67.0 /100 | #162 | Good 27.6% |
| Czechs | 65.3 /100 | #163 | Good 27.5% |
| Immigrants | Hong Kong | 64.9 /100 | #164 | Good 27.5% |
| Immigrants | South Africa | 61.3 /100 | #165 | Good 27.5% |
| Immigrants | Nonimmigrants | 61.2 /100 | #166 | Good 27.5% |
| Dominicans | 61.1 /100 | #167 | Good 27.5% |
| Immigrants | Kuwait | 60.9 /100 | #168 | Good 27.5% |
| Seminole | 56.9 /100 | #169 | Average 27.5% |
| Cherokee | 56.7 /100 | #170 | Average 27.5% |
| Blackfeet | 54.3 /100 | #171 | Average 27.5% |
| Israelis | 53.9 /100 | #172 | Average 27.5% |
| Immigrants | Argentina | 52.2 /100 | #173 | Average 27.5% |
| Whites/Caucasians | 50.0 /100 | #174 | Average 27.4% |