Honduran vs Ute Currently Married
COMPARE
Honduran
Ute
Currently Married
Currently Married Comparison
Hondurans
Ute
42.5%
CURRENTLY MARRIED
0.0/ 100
METRIC RATING
294th/ 347
METRIC RANK
43.9%
CURRENTLY MARRIED
0.2/ 100
METRIC RATING
258th/ 347
METRIC RANK
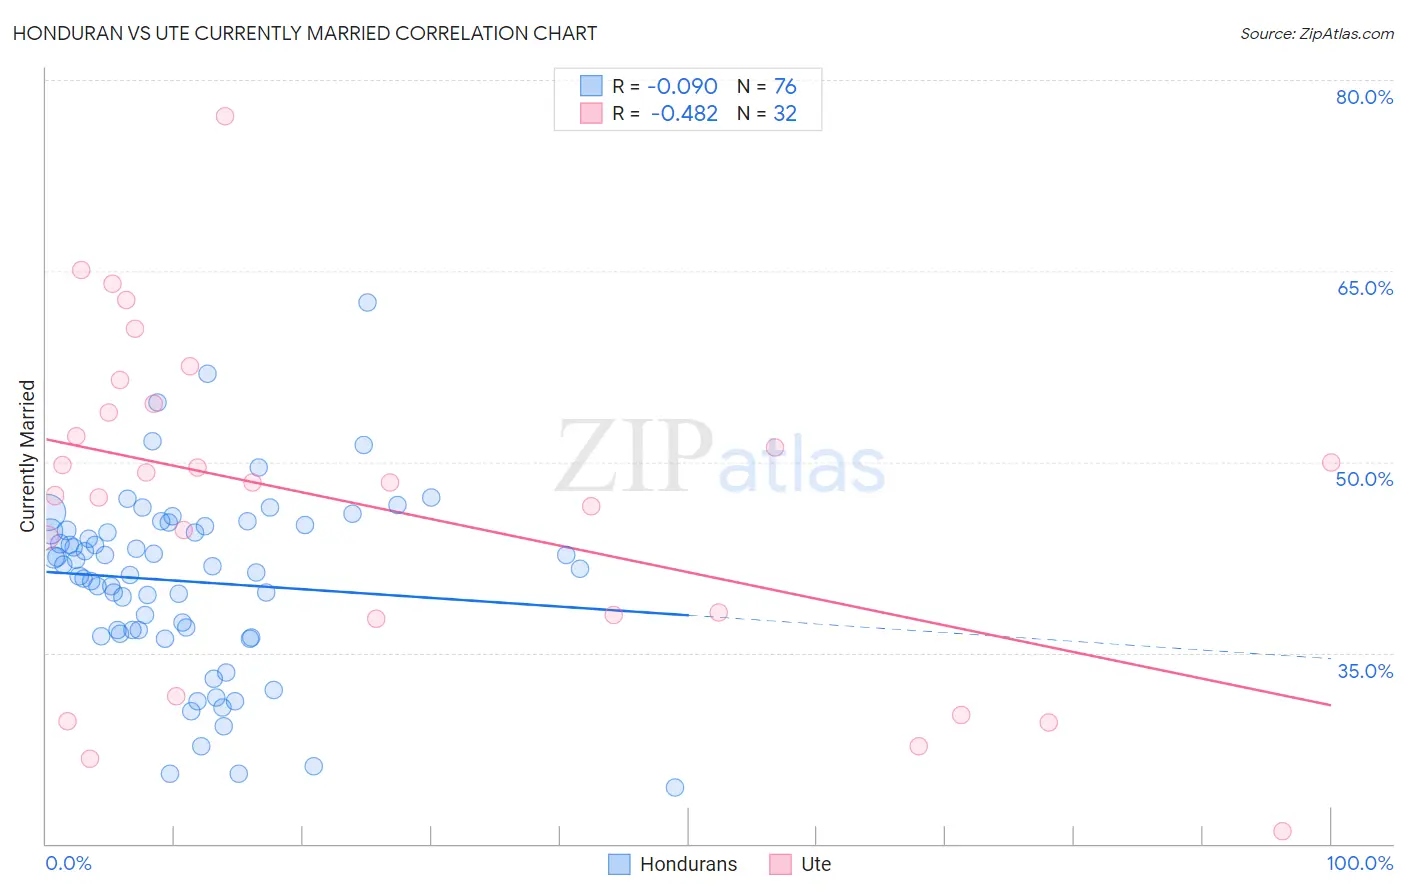
Honduran vs Ute Currently Married Correlation Chart
The statistical analysis conducted on geographies consisting of 357,812,977 people shows a slight negative correlation between the proportion of Hondurans and percentage of population currently married in the United States with a correlation coefficient (R) of -0.090 and weighted average of 42.5%. Similarly, the statistical analysis conducted on geographies consisting of 55,668,599 people shows a moderate negative correlation between the proportion of Ute and percentage of population currently married in the United States with a correlation coefficient (R) of -0.482 and weighted average of 43.9%, a difference of 3.2%.
Currently Married Correlation Summary
| Measurement | Honduran | Ute |
| Minimum | 24.4% | 21.0% |
| Maximum | 62.5% | 77.2% |
| Range | 38.1% | 56.2% |
| Mean | 40.6% | 46.6% |
| Median | 41.7% | 48.4% |
| Interquartile 25% (IQ1) | 36.6% | 37.9% |
| Interquartile 75% (IQ3) | 44.7% | 54.2% |
| Interquartile Range (IQR) | 8.1% | 16.4% |
| Standard Deviation (Sample) | 7.1% | 12.9% |
| Standard Deviation (Population) | 7.1% | 12.7% |
Similar Demographics by Currently Married
Demographics Similar to Hondurans by Currently Married
In terms of currently married, the demographic groups most similar to Hondurans are Yuman (42.6%, a difference of 0.12%), Subsaharan African (42.6%, a difference of 0.14%), Immigrants from Guatemala (42.6%, a difference of 0.30%), Immigrants from Western Africa (42.4%, a difference of 0.33%), and Immigrants from Ghana (42.7%, a difference of 0.41%).
| Demographics | Rating | Rank | Currently Married |
| Guatemalans | 0.0 /100 | #287 | Tragic 42.9% |
| Natives/Alaskans | 0.0 /100 | #288 | Tragic 42.8% |
| Paiute | 0.0 /100 | #289 | Tragic 42.7% |
| Immigrants | Ghana | 0.0 /100 | #290 | Tragic 42.7% |
| Immigrants | Guatemala | 0.0 /100 | #291 | Tragic 42.6% |
| Sub-Saharan Africans | 0.0 /100 | #292 | Tragic 42.6% |
| Yuman | 0.0 /100 | #293 | Tragic 42.6% |
| Hondurans | 0.0 /100 | #294 | Tragic 42.5% |
| Immigrants | Western Africa | 0.0 /100 | #295 | Tragic 42.4% |
| Menominee | 0.0 /100 | #296 | Tragic 42.3% |
| Cheyenne | 0.0 /100 | #297 | Tragic 42.2% |
| Immigrants | Honduras | 0.0 /100 | #298 | Tragic 42.2% |
| Liberians | 0.0 /100 | #299 | Tragic 42.2% |
| Belizeans | 0.0 /100 | #300 | Tragic 42.2% |
| Immigrants | Yemen | 0.0 /100 | #301 | Tragic 42.1% |
Demographics Similar to Ute by Currently Married
In terms of currently married, the demographic groups most similar to Ute are Immigrants from Africa (43.9%, a difference of 0.010%), Shoshone (44.0%, a difference of 0.21%), Immigrants from Sierra Leone (43.8%, a difference of 0.21%), Yakama (44.0%, a difference of 0.26%), and Immigrants from Latin America (43.8%, a difference of 0.27%).
| Demographics | Rating | Rank | Currently Married |
| Blackfeet | 0.3 /100 | #251 | Tragic 44.2% |
| Hispanics or Latinos | 0.3 /100 | #252 | Tragic 44.1% |
| Immigrants | Central America | 0.3 /100 | #253 | Tragic 44.1% |
| Vietnamese | 0.2 /100 | #254 | Tragic 44.0% |
| Yakama | 0.2 /100 | #255 | Tragic 44.0% |
| Shoshone | 0.2 /100 | #256 | Tragic 44.0% |
| Immigrants | Africa | 0.2 /100 | #257 | Tragic 43.9% |
| Ute | 0.2 /100 | #258 | Tragic 43.9% |
| Immigrants | Sierra Leone | 0.1 /100 | #259 | Tragic 43.8% |
| Immigrants | Latin America | 0.1 /100 | #260 | Tragic 43.8% |
| Immigrants | Nicaragua | 0.1 /100 | #261 | Tragic 43.7% |
| Bangladeshis | 0.1 /100 | #262 | Tragic 43.7% |
| Immigrants | Cuba | 0.1 /100 | #263 | Tragic 43.7% |
| Sudanese | 0.1 /100 | #264 | Tragic 43.7% |
| Immigrants | Bangladesh | 0.1 /100 | #265 | Tragic 43.6% |