Honduran vs Immigrants from Albania Currently Married
COMPARE
Honduran
Immigrants from Albania
Currently Married
Currently Married Comparison
Hondurans
Immigrants from Albania
42.5%
CURRENTLY MARRIED
0.0/ 100
METRIC RATING
294th/ 347
METRIC RANK
45.9%
CURRENTLY MARRIED
14.5/ 100
METRIC RATING
202nd/ 347
METRIC RANK
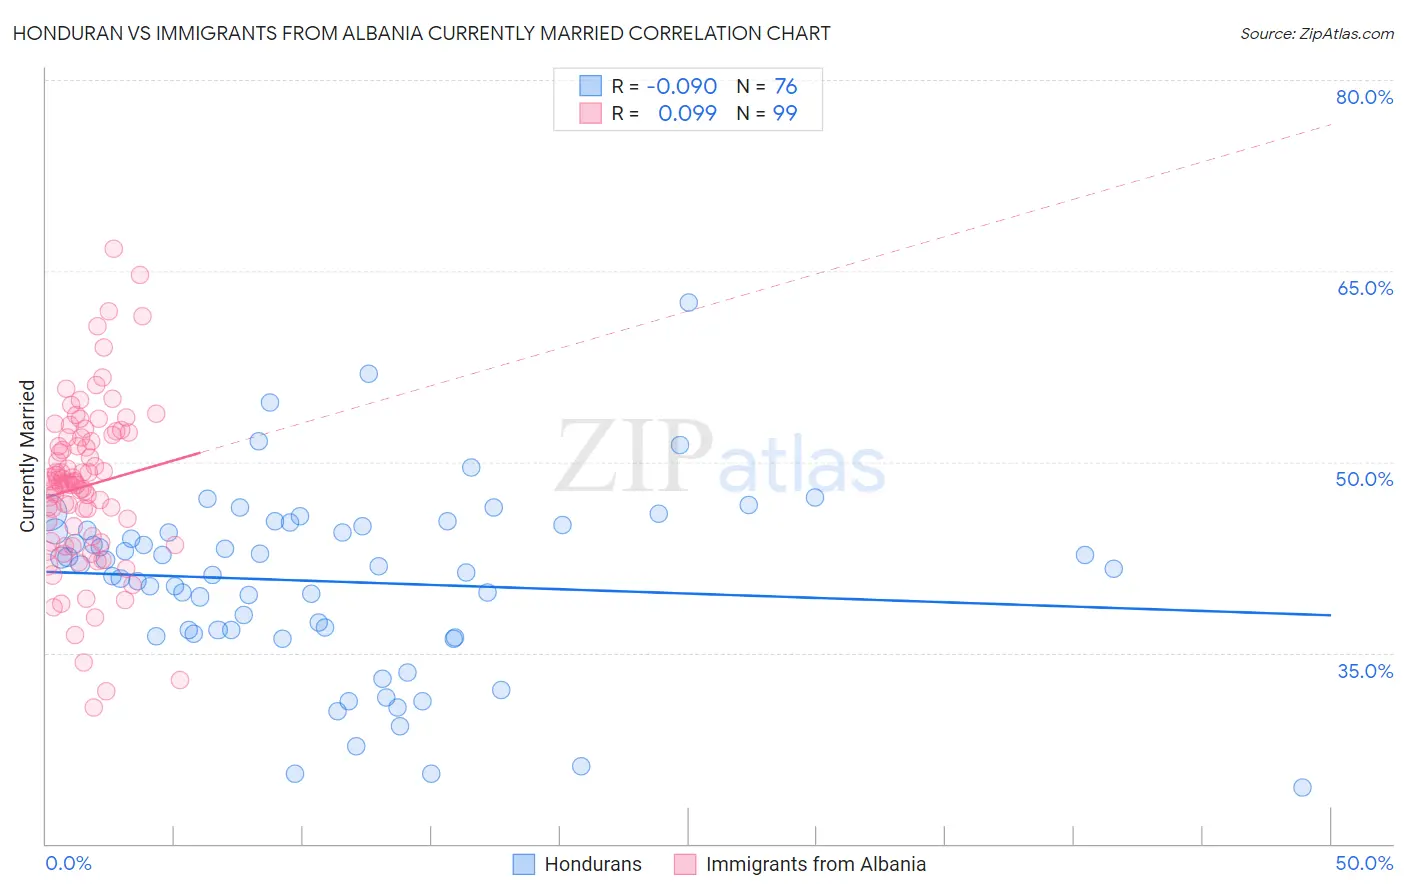
Honduran vs Immigrants from Albania Currently Married Correlation Chart
The statistical analysis conducted on geographies consisting of 357,812,977 people shows a slight negative correlation between the proportion of Hondurans and percentage of population currently married in the United States with a correlation coefficient (R) of -0.090 and weighted average of 42.5%. Similarly, the statistical analysis conducted on geographies consisting of 119,394,885 people shows a slight positive correlation between the proportion of Immigrants from Albania and percentage of population currently married in the United States with a correlation coefficient (R) of 0.099 and weighted average of 45.9%, a difference of 7.9%.
Currently Married Correlation Summary
| Measurement | Honduran | Immigrants from Albania |
| Minimum | 24.4% | 30.7% |
| Maximum | 62.5% | 66.7% |
| Range | 38.1% | 36.0% |
| Mean | 40.6% | 48.1% |
| Median | 41.7% | 48.4% |
| Interquartile 25% (IQ1) | 36.6% | 43.7% |
| Interquartile 75% (IQ3) | 44.7% | 51.9% |
| Interquartile Range (IQR) | 8.1% | 8.2% |
| Standard Deviation (Sample) | 7.1% | 6.5% |
| Standard Deviation (Population) | 7.1% | 6.4% |
Similar Demographics by Currently Married
Demographics Similar to Hondurans by Currently Married
In terms of currently married, the demographic groups most similar to Hondurans are Yuman (42.6%, a difference of 0.12%), Subsaharan African (42.6%, a difference of 0.14%), Immigrants from Guatemala (42.6%, a difference of 0.30%), Immigrants from Western Africa (42.4%, a difference of 0.33%), and Immigrants from Ghana (42.7%, a difference of 0.41%).
| Demographics | Rating | Rank | Currently Married |
| Guatemalans | 0.0 /100 | #287 | Tragic 42.9% |
| Natives/Alaskans | 0.0 /100 | #288 | Tragic 42.8% |
| Paiute | 0.0 /100 | #289 | Tragic 42.7% |
| Immigrants | Ghana | 0.0 /100 | #290 | Tragic 42.7% |
| Immigrants | Guatemala | 0.0 /100 | #291 | Tragic 42.6% |
| Sub-Saharan Africans | 0.0 /100 | #292 | Tragic 42.6% |
| Yuman | 0.0 /100 | #293 | Tragic 42.6% |
| Hondurans | 0.0 /100 | #294 | Tragic 42.5% |
| Immigrants | Western Africa | 0.0 /100 | #295 | Tragic 42.4% |
| Menominee | 0.0 /100 | #296 | Tragic 42.3% |
| Cheyenne | 0.0 /100 | #297 | Tragic 42.2% |
| Immigrants | Honduras | 0.0 /100 | #298 | Tragic 42.2% |
| Liberians | 0.0 /100 | #299 | Tragic 42.2% |
| Belizeans | 0.0 /100 | #300 | Tragic 42.2% |
| Immigrants | Yemen | 0.0 /100 | #301 | Tragic 42.1% |
Demographics Similar to Immigrants from Albania by Currently Married
In terms of currently married, the demographic groups most similar to Immigrants from Albania are Malaysian (45.9%, a difference of 0.060%), Creek (46.0%, a difference of 0.19%), Taiwanese (45.8%, a difference of 0.23%), Immigrants from Spain (45.8%, a difference of 0.24%), and South American Indian (45.8%, a difference of 0.25%).
| Demographics | Rating | Rank | Currently Married |
| Immigrants | Nepal | 23.7 /100 | #195 | Fair 46.1% |
| Immigrants | Bosnia and Herzegovina | 22.2 /100 | #196 | Fair 46.1% |
| Immigrants | Kuwait | 21.7 /100 | #197 | Fair 46.1% |
| Immigrants | Colombia | 21.0 /100 | #198 | Fair 46.1% |
| Immigrants | Costa Rica | 19.6 /100 | #199 | Poor 46.0% |
| Creek | 17.2 /100 | #200 | Poor 46.0% |
| Malaysians | 15.3 /100 | #201 | Poor 45.9% |
| Immigrants | Albania | 14.5 /100 | #202 | Poor 45.9% |
| Taiwanese | 11.7 /100 | #203 | Poor 45.8% |
| Immigrants | Spain | 11.6 /100 | #204 | Poor 45.8% |
| South American Indians | 11.5 /100 | #205 | Poor 45.8% |
| Immigrants | Immigrants | 11.2 /100 | #206 | Poor 45.8% |
| Immigrants | South America | 10.8 /100 | #207 | Poor 45.7% |
| Alsatians | 10.8 /100 | #208 | Poor 45.7% |
| Immigrants | Micronesia | 8.8 /100 | #209 | Tragic 45.6% |