Hmong vs Subsaharan African Single Father Households
COMPARE
Hmong
Subsaharan African
Single Father Households
Single Father Households Comparison
Hmong
Sub-Saharan Africans
2.4%
SINGLE FATHER HOUSEHOLDS
33.0/ 100
METRIC RATING
188th/ 347
METRIC RANK
2.4%
SINGLE FATHER HOUSEHOLDS
8.3/ 100
METRIC RATING
230th/ 347
METRIC RANK
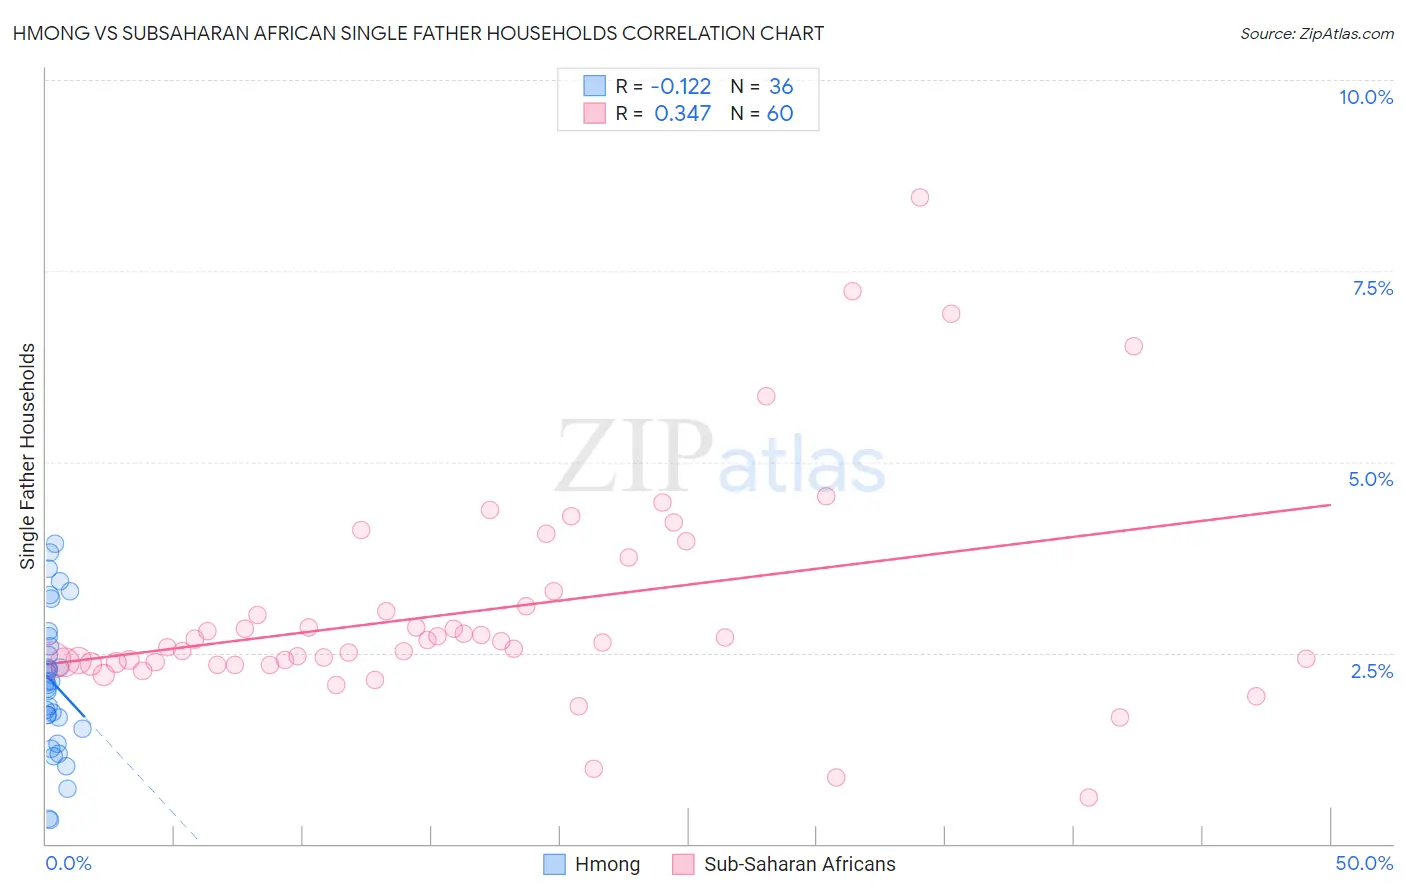
Hmong vs Subsaharan African Single Father Households Correlation Chart
The statistical analysis conducted on geographies consisting of 24,655,242 people shows a poor negative correlation between the proportion of Hmong and percentage of single father households in the United States with a correlation coefficient (R) of -0.122 and weighted average of 2.4%. Similarly, the statistical analysis conducted on geographies consisting of 500,994,896 people shows a mild positive correlation between the proportion of Sub-Saharan Africans and percentage of single father households in the United States with a correlation coefficient (R) of 0.347 and weighted average of 2.4%, a difference of 3.1%.
Single Father Households Correlation Summary
| Measurement | Hmong | Subsaharan African |
| Minimum | 0.30% | 0.60% |
| Maximum | 3.9% | 8.5% |
| Range | 3.6% | 7.9% |
| Mean | 2.1% | 3.1% |
| Median | 2.1% | 2.6% |
| Interquartile 25% (IQ1) | 1.6% | 2.4% |
| Interquartile 75% (IQ3) | 2.7% | 3.2% |
| Interquartile Range (IQR) | 1.1% | 0.83% |
| Standard Deviation (Sample) | 0.92% | 1.5% |
| Standard Deviation (Population) | 0.91% | 1.4% |
Similar Demographics by Single Father Households
Demographics Similar to Hmong by Single Father Households
In terms of single father households, the demographic groups most similar to Hmong are Immigrants from Colombia (2.4%, a difference of 0.080%), U.S. Virgin Islander (2.4%, a difference of 0.10%), French (2.4%, a difference of 0.11%), Immigrants from Africa (2.4%, a difference of 0.25%), and Immigrants from Sudan (2.4%, a difference of 0.27%).
| Demographics | Rating | Rank | Single Father Households |
| Jamaicans | 43.5 /100 | #181 | Average 2.3% |
| Belgians | 43.3 /100 | #182 | Average 2.3% |
| Immigrants | Panama | 41.8 /100 | #183 | Average 2.4% |
| Sri Lankans | 41.8 /100 | #184 | Average 2.4% |
| Nigerians | 41.0 /100 | #185 | Average 2.4% |
| Immigrants | Bosnia and Herzegovina | 40.4 /100 | #186 | Average 2.4% |
| Immigrants | Colombia | 34.0 /100 | #187 | Fair 2.4% |
| Hmong | 33.0 /100 | #188 | Fair 2.4% |
| U.S. Virgin Islanders | 31.8 /100 | #189 | Fair 2.4% |
| French | 31.7 /100 | #190 | Fair 2.4% |
| Immigrants | Africa | 30.0 /100 | #191 | Fair 2.4% |
| Immigrants | Sudan | 29.8 /100 | #192 | Fair 2.4% |
| Uruguayans | 29.7 /100 | #193 | Fair 2.4% |
| Panamanians | 29.6 /100 | #194 | Fair 2.4% |
| Immigrants | Philippines | 28.7 /100 | #195 | Fair 2.4% |
Demographics Similar to Sub-Saharan Africans by Single Father Households
In terms of single father households, the demographic groups most similar to Sub-Saharan Africans are Immigrants from Zaire (2.4%, a difference of 0.090%), Nonimmigrants (2.4%, a difference of 0.16%), Immigrants from Ghana (2.4%, a difference of 0.20%), American (2.4%, a difference of 0.24%), and Pennsylvania German (2.4%, a difference of 0.25%).
| Demographics | Rating | Rank | Single Father Households |
| Immigrants | Uruguay | 11.0 /100 | #223 | Poor 2.4% |
| Immigrants | Bahamas | 10.6 /100 | #224 | Poor 2.4% |
| Marshallese | 9.7 /100 | #225 | Tragic 2.4% |
| Blacks/African Americans | 9.7 /100 | #226 | Tragic 2.4% |
| Americans | 9.3 /100 | #227 | Tragic 2.4% |
| Immigrants | Ghana | 9.1 /100 | #228 | Tragic 2.4% |
| Immigrants | Zaire | 8.6 /100 | #229 | Tragic 2.4% |
| Sub-Saharan Africans | 8.3 /100 | #230 | Tragic 2.4% |
| Immigrants | Nonimmigrants | 7.6 /100 | #231 | Tragic 2.4% |
| Pennsylvania Germans | 7.3 /100 | #232 | Tragic 2.4% |
| Immigrants | Western Africa | 7.0 /100 | #233 | Tragic 2.4% |
| Africans | 6.3 /100 | #234 | Tragic 2.5% |
| Immigrants | Immigrants | 6.3 /100 | #235 | Tragic 2.5% |
| Cajuns | 6.1 /100 | #236 | Tragic 2.5% |
| Sierra Leoneans | 5.9 /100 | #237 | Tragic 2.5% |