Hmong vs Immigrants from Iraq Family Households with Children
COMPARE
Hmong
Immigrants from Iraq
Family Households with Children
Family Households with Children Comparison
Hmong
Immigrants from Iraq
28.6%
FAMILY HOUSEHOLDS WITH CHILDREN
99.9/ 100
METRIC RATING
60th/ 347
METRIC RANK
28.4%
FAMILY HOUSEHOLDS WITH CHILDREN
99.8/ 100
METRIC RATING
79th/ 347
METRIC RANK
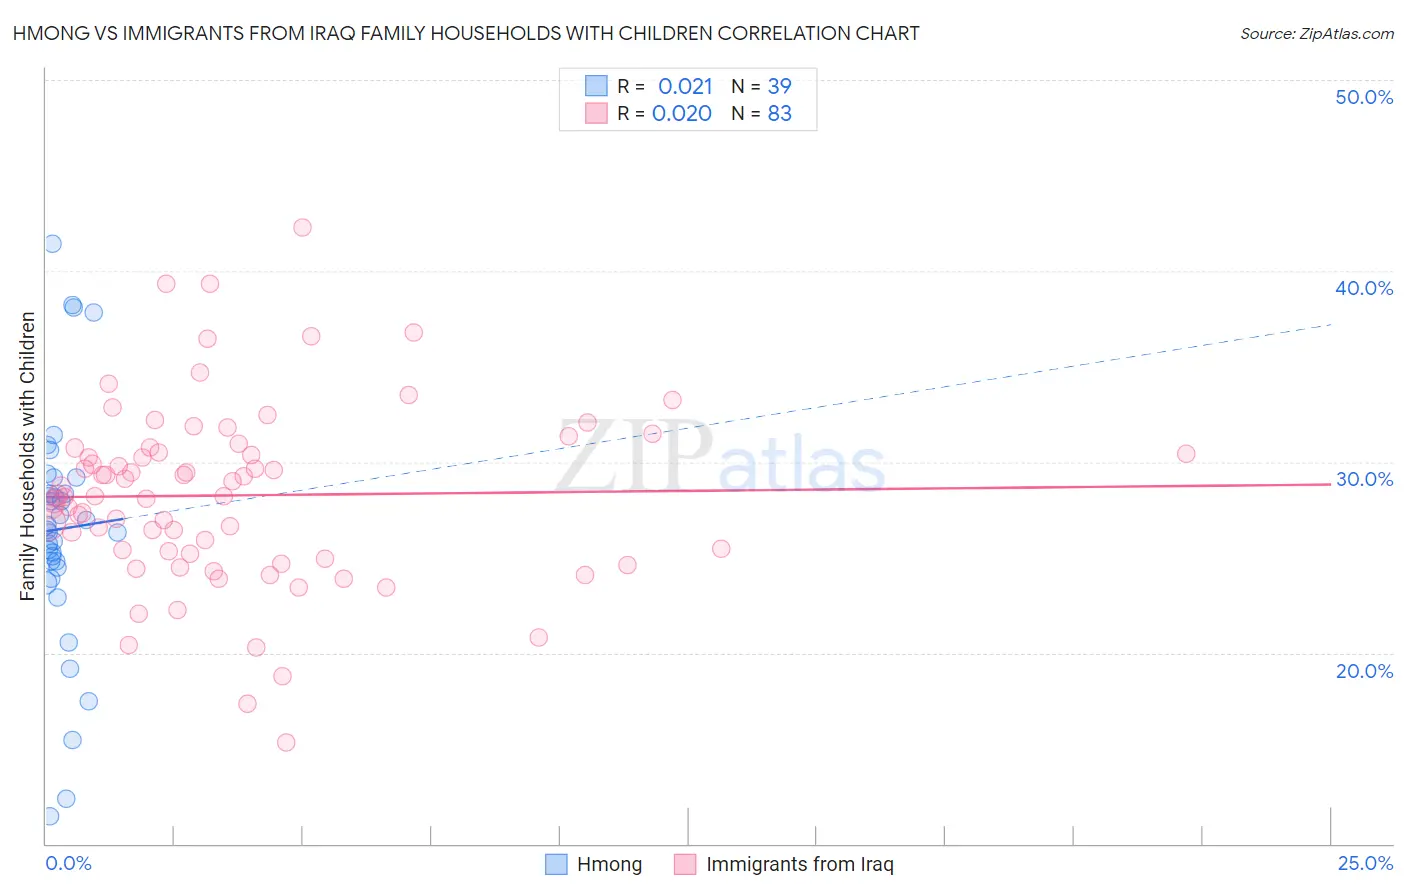
Hmong vs Immigrants from Iraq Family Households with Children Correlation Chart
The statistical analysis conducted on geographies consisting of 24,678,157 people shows no correlation between the proportion of Hmong and percentage of family households with children in the United States with a correlation coefficient (R) of 0.021 and weighted average of 28.6%. Similarly, the statistical analysis conducted on geographies consisting of 194,748,370 people shows no correlation between the proportion of Immigrants from Iraq and percentage of family households with children in the United States with a correlation coefficient (R) of 0.020 and weighted average of 28.4%, a difference of 0.66%.
Family Households with Children Correlation Summary
| Measurement | Hmong | Immigrants from Iraq |
| Minimum | 11.4% | 15.3% |
| Maximum | 41.4% | 42.3% |
| Range | 30.0% | 27.0% |
| Mean | 26.5% | 28.2% |
| Median | 26.4% | 28.2% |
| Interquartile 25% (IQ1) | 24.5% | 25.2% |
| Interquartile 75% (IQ3) | 29.2% | 30.7% |
| Interquartile Range (IQR) | 4.7% | 5.6% |
| Standard Deviation (Sample) | 6.3% | 4.8% |
| Standard Deviation (Population) | 6.2% | 4.7% |
Demographics Similar to Hmong and Immigrants from Iraq by Family Households with Children
In terms of family households with children, the demographic groups most similar to Hmong are Immigrants from Nigeria (28.6%, a difference of 0.060%), Immigrants from Ghana (28.6%, a difference of 0.070%), Egyptian (28.6%, a difference of 0.080%), Immigrants from Lebanon (28.6%, a difference of 0.090%), and Filipino (28.6%, a difference of 0.16%). Similarly, the demographic groups most similar to Immigrants from Iraq are Immigrants from Nepal (28.4%, a difference of 0.030%), Nigerian (28.4%, a difference of 0.070%), Immigrants from Sri Lanka (28.4%, a difference of 0.12%), Immigrants from Jordan (28.4%, a difference of 0.13%), and Laotian (28.5%, a difference of 0.26%).
| Demographics | Rating | Rank | Family Households with Children |
| Immigrants | Nigeria | 100.0 /100 | #59 | Exceptional 28.6% |
| Hmong | 99.9 /100 | #60 | Exceptional 28.6% |
| Immigrants | Ghana | 99.9 /100 | #61 | Exceptional 28.6% |
| Egyptians | 99.9 /100 | #62 | Exceptional 28.6% |
| Immigrants | Lebanon | 99.9 /100 | #63 | Exceptional 28.6% |
| Filipinos | 99.9 /100 | #64 | Exceptional 28.6% |
| Hondurans | 99.9 /100 | #65 | Exceptional 28.5% |
| Immigrants | Egypt | 99.9 /100 | #66 | Exceptional 28.5% |
| Ghanaians | 99.9 /100 | #67 | Exceptional 28.5% |
| Houma | 99.9 /100 | #68 | Exceptional 28.5% |
| Immigrants | Korea | 99.9 /100 | #69 | Exceptional 28.5% |
| Immigrants | Honduras | 99.9 /100 | #70 | Exceptional 28.5% |
| Burmese | 99.9 /100 | #71 | Exceptional 28.5% |
| Immigrants | Indonesia | 99.9 /100 | #72 | Exceptional 28.5% |
| Iraqis | 99.9 /100 | #73 | Exceptional 28.5% |
| Laotians | 99.9 /100 | #74 | Exceptional 28.5% |
| Immigrants | Jordan | 99.9 /100 | #75 | Exceptional 28.4% |
| Immigrants | Sri Lanka | 99.9 /100 | #76 | Exceptional 28.4% |
| Nigerians | 99.8 /100 | #77 | Exceptional 28.4% |
| Immigrants | Nepal | 99.8 /100 | #78 | Exceptional 28.4% |
| Immigrants | Iraq | 99.8 /100 | #79 | Exceptional 28.4% |