Hmong vs Immigrants from Eritrea Family Households with Children
COMPARE
Hmong
Immigrants from Eritrea
Family Households with Children
Family Households with Children Comparison
Hmong
Immigrants from Eritrea
28.6%
FAMILY HOUSEHOLDS WITH CHILDREN
99.9/ 100
METRIC RATING
60th/ 347
METRIC RANK
27.8%
FAMILY HOUSEHOLDS WITH CHILDREN
89.4/ 100
METRIC RATING
129th/ 347
METRIC RANK
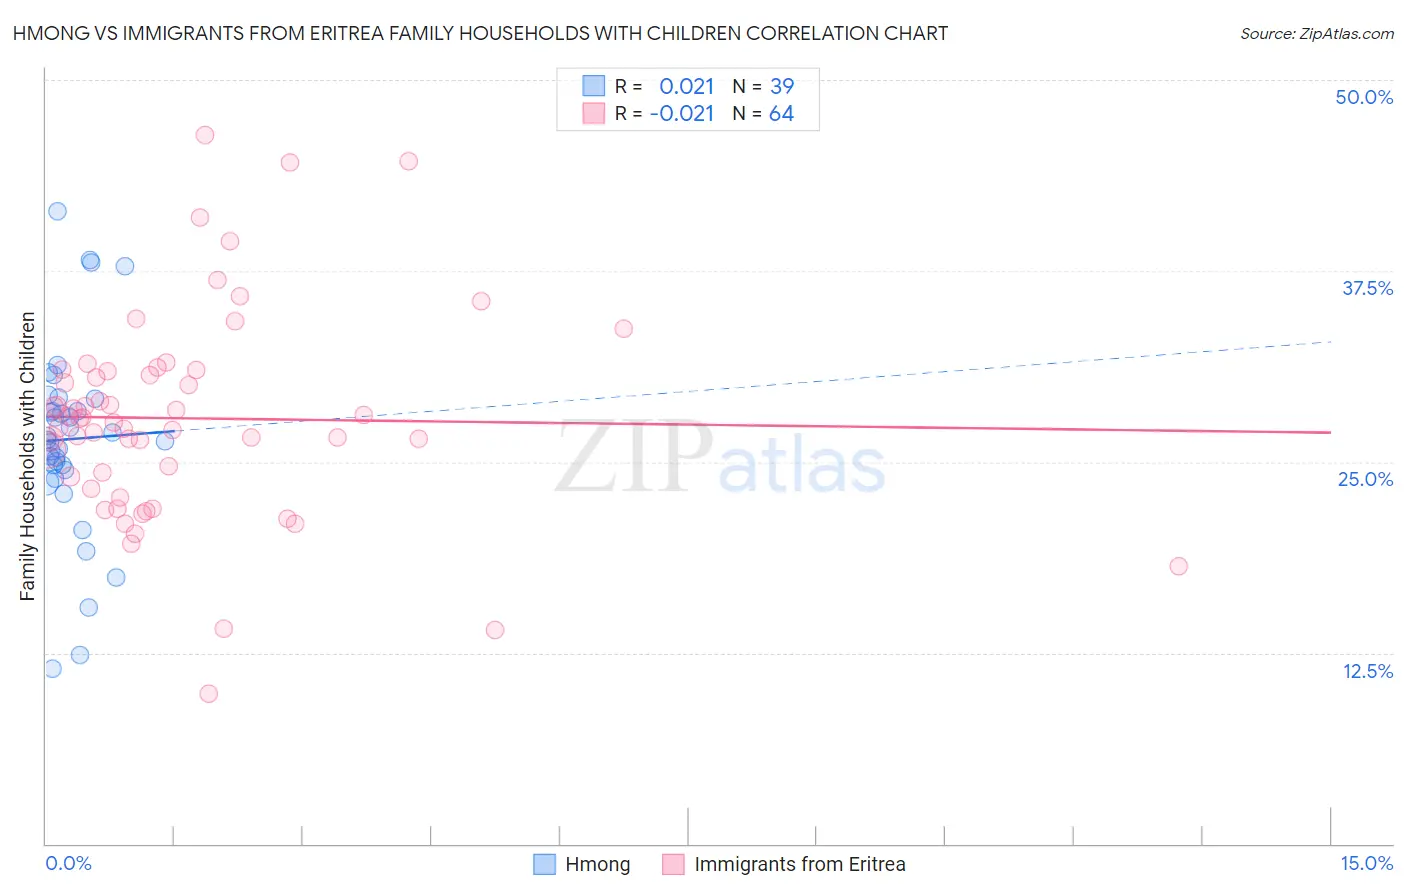
Hmong vs Immigrants from Eritrea Family Households with Children Correlation Chart
The statistical analysis conducted on geographies consisting of 24,678,157 people shows no correlation between the proportion of Hmong and percentage of family households with children in the United States with a correlation coefficient (R) of 0.021 and weighted average of 28.6%. Similarly, the statistical analysis conducted on geographies consisting of 104,846,826 people shows no correlation between the proportion of Immigrants from Eritrea and percentage of family households with children in the United States with a correlation coefficient (R) of -0.021 and weighted average of 27.8%, a difference of 3.0%.
Family Households with Children Correlation Summary
| Measurement | Hmong | Immigrants from Eritrea |
| Minimum | 11.4% | 9.8% |
| Maximum | 41.4% | 46.4% |
| Range | 30.0% | 36.5% |
| Mean | 26.5% | 27.9% |
| Median | 26.4% | 27.7% |
| Interquartile 25% (IQ1) | 24.5% | 23.6% |
| Interquartile 75% (IQ3) | 29.2% | 31.0% |
| Interquartile Range (IQR) | 4.7% | 7.3% |
| Standard Deviation (Sample) | 6.3% | 6.9% |
| Standard Deviation (Population) | 6.2% | 6.8% |
Similar Demographics by Family Households with Children
Demographics Similar to Hmong by Family Households with Children
In terms of family households with children, the demographic groups most similar to Hmong are Immigrants from Nigeria (28.6%, a difference of 0.060%), Immigrants from Ghana (28.6%, a difference of 0.070%), Egyptian (28.6%, a difference of 0.080%), Immigrants from Lebanon (28.6%, a difference of 0.090%), and Filipino (28.6%, a difference of 0.16%).
| Demographics | Rating | Rank | Family Households with Children |
| Immigrants | Cambodia | 100.0 /100 | #53 | Exceptional 28.9% |
| Sierra Leoneans | 100.0 /100 | #54 | Exceptional 28.9% |
| Immigrants | Asia | 100.0 /100 | #55 | Exceptional 28.8% |
| Immigrants | Guatemala | 100.0 /100 | #56 | Exceptional 28.8% |
| Danes | 100.0 /100 | #57 | Exceptional 28.7% |
| Hawaiians | 100.0 /100 | #58 | Exceptional 28.7% |
| Immigrants | Nigeria | 100.0 /100 | #59 | Exceptional 28.6% |
| Hmong | 99.9 /100 | #60 | Exceptional 28.6% |
| Immigrants | Ghana | 99.9 /100 | #61 | Exceptional 28.6% |
| Egyptians | 99.9 /100 | #62 | Exceptional 28.6% |
| Immigrants | Lebanon | 99.9 /100 | #63 | Exceptional 28.6% |
| Filipinos | 99.9 /100 | #64 | Exceptional 28.6% |
| Hondurans | 99.9 /100 | #65 | Exceptional 28.5% |
| Immigrants | Egypt | 99.9 /100 | #66 | Exceptional 28.5% |
| Ghanaians | 99.9 /100 | #67 | Exceptional 28.5% |
Demographics Similar to Immigrants from Eritrea by Family Households with Children
In terms of family households with children, the demographic groups most similar to Immigrants from Eritrea are Syrian (27.8%, a difference of 0.020%), Belizean (27.8%, a difference of 0.040%), Immigrants from Ethiopia (27.8%, a difference of 0.070%), Immigrants from Singapore (27.8%, a difference of 0.090%), and Ecuadorian (27.8%, a difference of 0.090%).
| Demographics | Rating | Rank | Family Households with Children |
| Immigrants | Zimbabwe | 92.8 /100 | #122 | Exceptional 27.8% |
| Immigrants | Northern Africa | 91.8 /100 | #123 | Exceptional 27.8% |
| Immigrants | Singapore | 90.8 /100 | #124 | Exceptional 27.8% |
| Ecuadorians | 90.8 /100 | #125 | Exceptional 27.8% |
| Immigrants | Ethiopia | 90.5 /100 | #126 | Exceptional 27.8% |
| Belizeans | 90.0 /100 | #127 | Exceptional 27.8% |
| Syrians | 89.7 /100 | #128 | Excellent 27.8% |
| Immigrants | Eritrea | 89.4 /100 | #129 | Excellent 27.8% |
| Cajuns | 87.6 /100 | #130 | Excellent 27.7% |
| Lebanese | 87.4 /100 | #131 | Excellent 27.7% |
| Immigrants | Belize | 85.7 /100 | #132 | Excellent 27.7% |
| Iranians | 85.2 /100 | #133 | Excellent 27.7% |
| Immigrants | Panama | 84.9 /100 | #134 | Excellent 27.7% |
| Immigrants | Ecuador | 84.6 /100 | #135 | Excellent 27.7% |
| Immigrants | Portugal | 84.1 /100 | #136 | Excellent 27.7% |