Ecuadorian vs Immigrants from Burma/Myanmar Family Households with Children
COMPARE
Ecuadorian
Immigrants from Burma/Myanmar
Family Households with Children
Family Households with Children Comparison
Ecuadorians
Immigrants from Burma/Myanmar
27.8%
FAMILY HOUSEHOLDS WITH CHILDREN
90.8/ 100
METRIC RATING
125th/ 347
METRIC RANK
28.0%
FAMILY HOUSEHOLDS WITH CHILDREN
97.7/ 100
METRIC RATING
108th/ 347
METRIC RANK
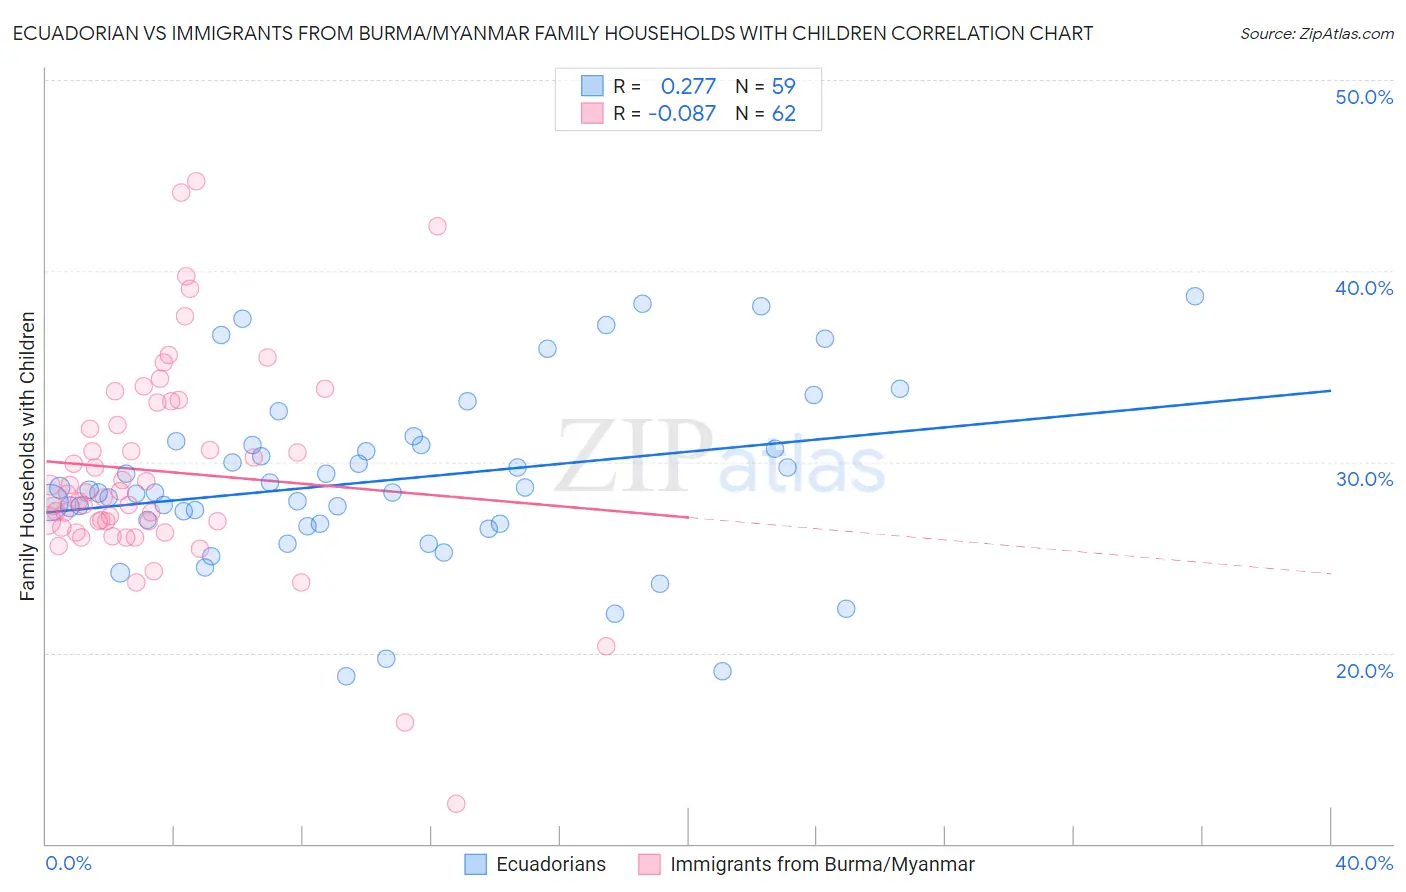
Ecuadorian vs Immigrants from Burma/Myanmar Family Households with Children Correlation Chart
The statistical analysis conducted on geographies consisting of 317,541,400 people shows a weak positive correlation between the proportion of Ecuadorians and percentage of family households with children in the United States with a correlation coefficient (R) of 0.277 and weighted average of 27.8%. Similarly, the statistical analysis conducted on geographies consisting of 172,235,396 people shows a slight negative correlation between the proportion of Immigrants from Burma/Myanmar and percentage of family households with children in the United States with a correlation coefficient (R) of -0.087 and weighted average of 28.0%, a difference of 0.78%.
Family Households with Children Correlation Summary
| Measurement | Ecuadorian | Immigrants from Burma/Myanmar |
| Minimum | 18.8% | 12.1% |
| Maximum | 38.7% | 44.7% |
| Range | 19.9% | 32.6% |
| Mean | 29.0% | 29.5% |
| Median | 28.4% | 28.3% |
| Interquartile 25% (IQ1) | 26.7% | 26.9% |
| Interquartile 75% (IQ3) | 30.9% | 33.1% |
| Interquartile Range (IQR) | 4.1% | 6.2% |
| Standard Deviation (Sample) | 4.6% | 5.7% |
| Standard Deviation (Population) | 4.5% | 5.6% |
Demographics Similar to Ecuadorians and Immigrants from Burma/Myanmar by Family Households with Children
In terms of family households with children, the demographic groups most similar to Ecuadorians are Immigrants from Singapore (27.8%, a difference of 0.0%), Immigrants from Ethiopia (27.8%, a difference of 0.020%), Immigrants from Northern Africa (27.8%, a difference of 0.070%), Immigrants from Zimbabwe (27.8%, a difference of 0.14%), and Immigrants from Western Asia (27.9%, a difference of 0.21%). Similarly, the demographic groups most similar to Immigrants from Burma/Myanmar are Immigrants from Uganda (28.0%, a difference of 0.010%), Tohono O'odham (28.0%, a difference of 0.010%), Spaniard (28.0%, a difference of 0.050%), Immigrants from South America (28.0%, a difference of 0.080%), and Scandinavian (28.0%, a difference of 0.11%).
| Demographics | Rating | Rank | Family Households with Children |
| Immigrants | South America | 98.0 /100 | #106 | Exceptional 28.0% |
| Immigrants | Uganda | 97.7 /100 | #107 | Exceptional 28.0% |
| Immigrants | Burma/Myanmar | 97.7 /100 | #108 | Exceptional 28.0% |
| Tohono O'odham | 97.6 /100 | #109 | Exceptional 28.0% |
| Spaniards | 97.4 /100 | #110 | Exceptional 28.0% |
| Scandinavians | 97.1 /100 | #111 | Exceptional 28.0% |
| Immigrants | Middle Africa | 97.0 /100 | #112 | Exceptional 28.0% |
| Arabs | 97.0 /100 | #113 | Exceptional 28.0% |
| South American Indians | 96.9 /100 | #114 | Exceptional 28.0% |
| Immigrants | Africa | 96.8 /100 | #115 | Exceptional 28.0% |
| Pakistanis | 96.0 /100 | #116 | Exceptional 27.9% |
| Immigrants | Malaysia | 95.9 /100 | #117 | Exceptional 27.9% |
| Central American Indians | 95.9 /100 | #118 | Exceptional 27.9% |
| Zimbabweans | 95.6 /100 | #119 | Exceptional 27.9% |
| Europeans | 95.4 /100 | #120 | Exceptional 27.9% |
| Immigrants | Western Asia | 93.6 /100 | #121 | Exceptional 27.9% |
| Immigrants | Zimbabwe | 92.8 /100 | #122 | Exceptional 27.8% |
| Immigrants | Northern Africa | 91.8 /100 | #123 | Exceptional 27.8% |
| Immigrants | Singapore | 90.8 /100 | #124 | Exceptional 27.8% |
| Ecuadorians | 90.8 /100 | #125 | Exceptional 27.8% |
| Immigrants | Ethiopia | 90.5 /100 | #126 | Exceptional 27.8% |