Eastern European vs Cypriot Single Father Households
COMPARE
Eastern European
Cypriot
Single Father Households
Single Father Households Comparison
Eastern Europeans
Cypriots
2.0%
SINGLE FATHER HOUSEHOLDS
100.0/ 100
METRIC RATING
25th/ 347
METRIC RANK
1.8%
SINGLE FATHER HOUSEHOLDS
100.0/ 100
METRIC RATING
7th/ 347
METRIC RANK
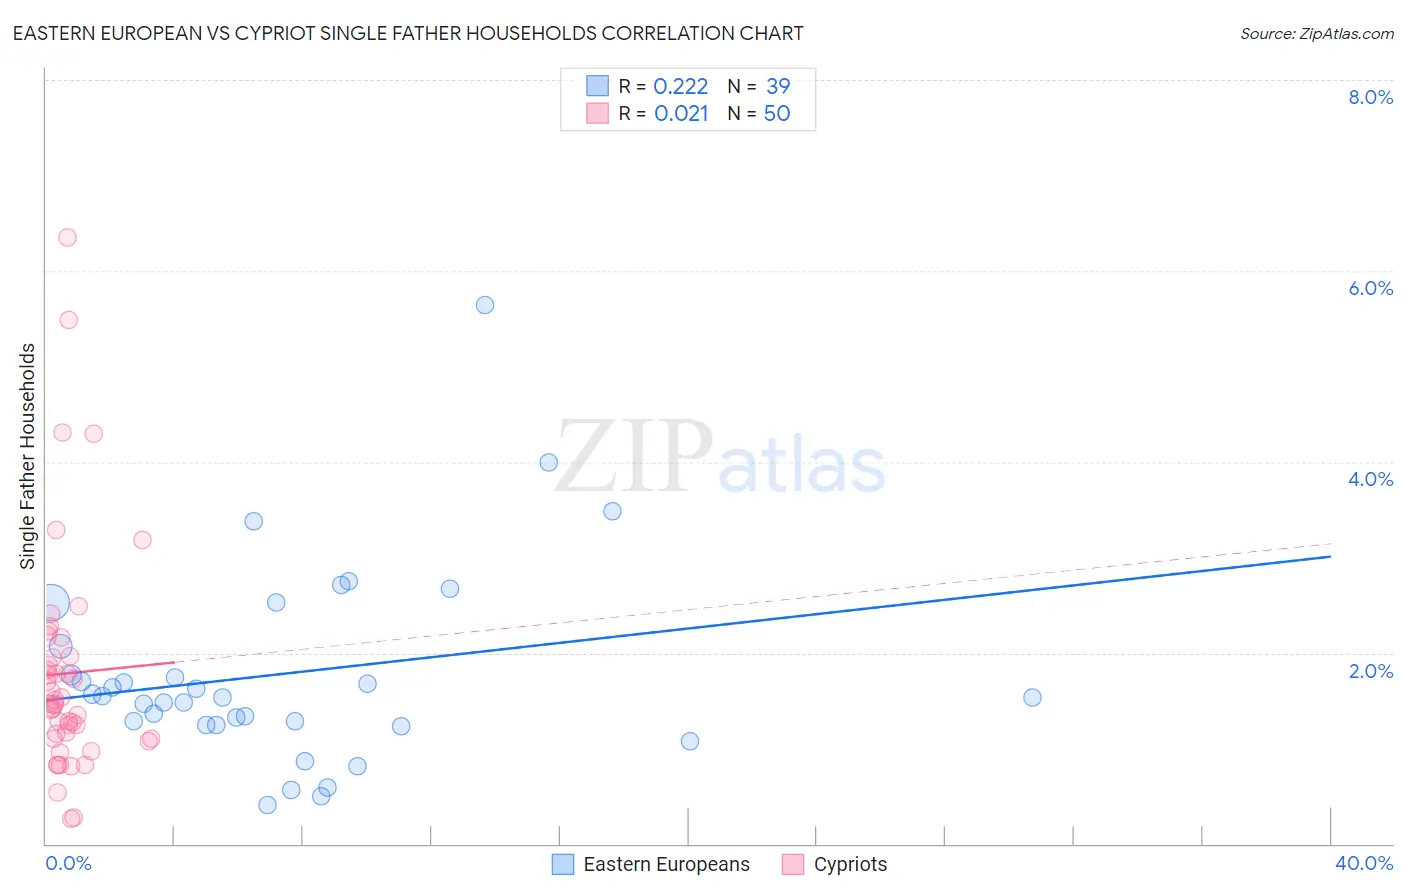
Eastern European vs Cypriot Single Father Households Correlation Chart
The statistical analysis conducted on geographies consisting of 454,825,702 people shows a weak positive correlation between the proportion of Eastern Europeans and percentage of single father households in the United States with a correlation coefficient (R) of 0.222 and weighted average of 2.0%. Similarly, the statistical analysis conducted on geographies consisting of 61,632,600 people shows no correlation between the proportion of Cypriots and percentage of single father households in the United States with a correlation coefficient (R) of 0.021 and weighted average of 1.8%, a difference of 6.2%.
Single Father Households Correlation Summary
| Measurement | Eastern European | Cypriot |
| Minimum | 0.41% | 0.26% |
| Maximum | 5.6% | 6.4% |
| Range | 5.2% | 6.1% |
| Mean | 1.8% | 1.8% |
| Median | 1.5% | 1.5% |
| Interquartile 25% (IQ1) | 1.2% | 1.1% |
| Interquartile 75% (IQ3) | 2.1% | 2.0% |
| Interquartile Range (IQR) | 0.82% | 0.87% |
| Standard Deviation (Sample) | 1.0% | 1.2% |
| Standard Deviation (Population) | 1.0% | 1.2% |
Demographics Similar to Eastern Europeans and Cypriots by Single Father Households
In terms of single father households, the demographic groups most similar to Eastern Europeans are Immigrants from Russia (2.0%, a difference of 0.0%), Immigrants from Croatia (2.0%, a difference of 0.010%), Assyrian/Chaldean/Syriac (2.0%, a difference of 0.14%), Immigrants from Latvia (1.9%, a difference of 1.2%), and Immigrants from Albania (1.9%, a difference of 1.4%). Similarly, the demographic groups most similar to Cypriots are Immigrants from Ireland (1.8%, a difference of 0.11%), Immigrants from Taiwan (1.8%, a difference of 0.16%), Immigrants from China (1.8%, a difference of 0.25%), Okinawan (1.9%, a difference of 0.61%), and Immigrants from Belarus (1.9%, a difference of 0.93%).
| Demographics | Rating | Rank | Single Father Households |
| Immigrants | Taiwan | 100.0 /100 | #6 | Exceptional 1.8% |
| Cypriots | 100.0 /100 | #7 | Exceptional 1.8% |
| Immigrants | Ireland | 100.0 /100 | #8 | Exceptional 1.8% |
| Immigrants | China | 100.0 /100 | #9 | Exceptional 1.8% |
| Okinawans | 100.0 /100 | #10 | Exceptional 1.9% |
| Immigrants | Belarus | 100.0 /100 | #11 | Exceptional 1.9% |
| Immigrants | Greece | 100.0 /100 | #12 | Exceptional 1.9% |
| Immigrants | Singapore | 100.0 /100 | #13 | Exceptional 1.9% |
| Immigrants | Lithuania | 100.0 /100 | #14 | Exceptional 1.9% |
| Immigrants | Eastern Asia | 100.0 /100 | #15 | Exceptional 1.9% |
| Immigrants | Iran | 100.0 /100 | #16 | Exceptional 1.9% |
| Immigrants | India | 100.0 /100 | #17 | Exceptional 1.9% |
| Indians (Asian) | 100.0 /100 | #18 | Exceptional 1.9% |
| Iranians | 100.0 /100 | #19 | Exceptional 1.9% |
| Thais | 100.0 /100 | #20 | Exceptional 1.9% |
| Immigrants | Albania | 100.0 /100 | #21 | Exceptional 1.9% |
| Immigrants | Latvia | 100.0 /100 | #22 | Exceptional 1.9% |
| Immigrants | Croatia | 100.0 /100 | #23 | Exceptional 2.0% |
| Immigrants | Russia | 100.0 /100 | #24 | Exceptional 2.0% |
| Eastern Europeans | 100.0 /100 | #25 | Exceptional 2.0% |
| Assyrians/Chaldeans/Syriacs | 100.0 /100 | #26 | Exceptional 2.0% |