Central American Indian vs Cypriot Single Father Households
COMPARE
Central American Indian
Cypriot
Single Father Households
Single Father Households Comparison
Central American Indians
Cypriots
2.7%
SINGLE FATHER HOUSEHOLDS
0.0/ 100
METRIC RATING
287th/ 347
METRIC RANK
1.8%
SINGLE FATHER HOUSEHOLDS
100.0/ 100
METRIC RATING
7th/ 347
METRIC RANK
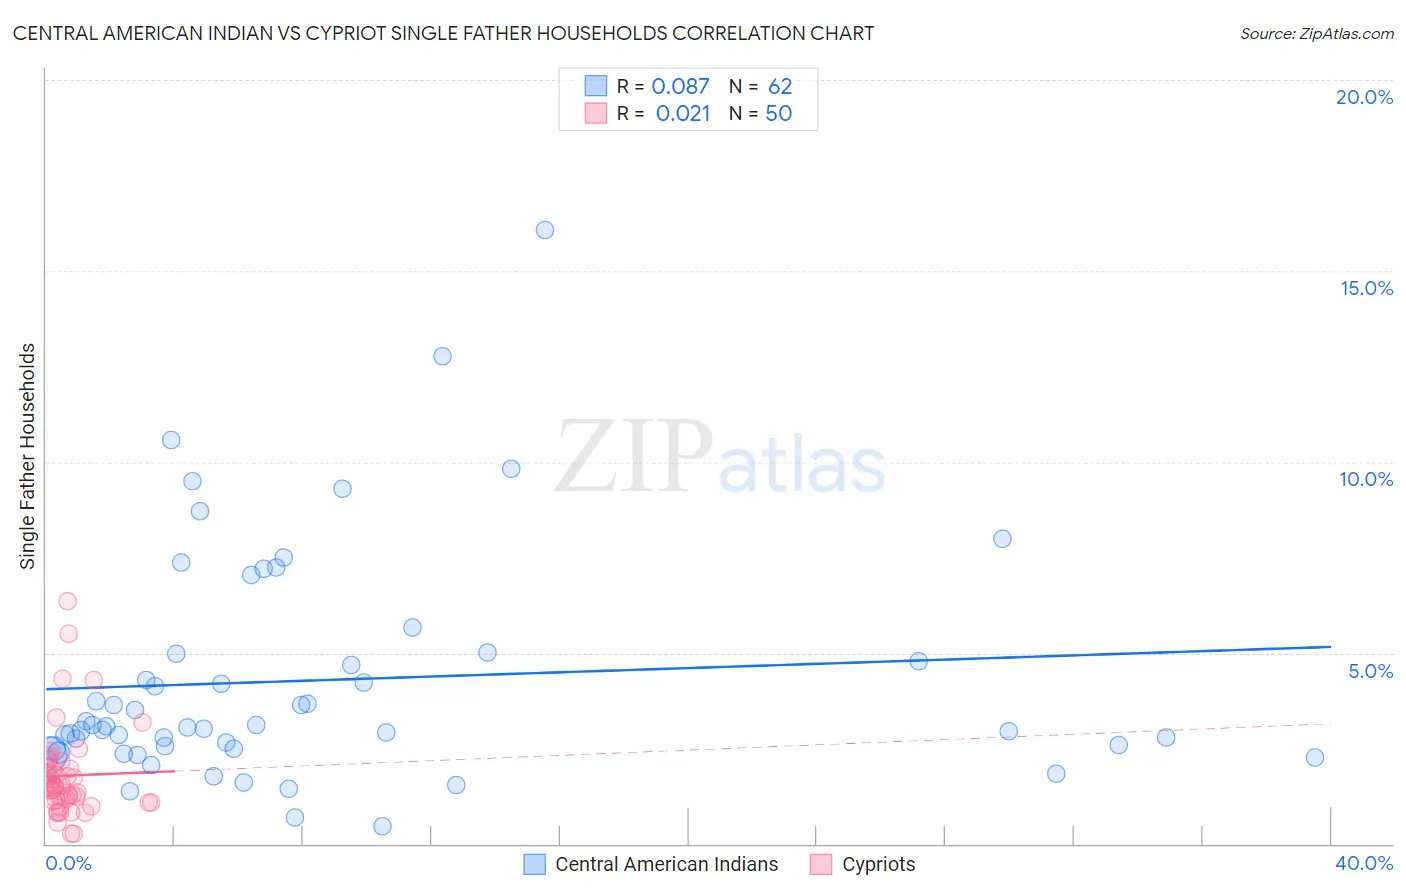
Central American Indian vs Cypriot Single Father Households Correlation Chart
The statistical analysis conducted on geographies consisting of 324,676,108 people shows a slight positive correlation between the proportion of Central American Indians and percentage of single father households in the United States with a correlation coefficient (R) of 0.087 and weighted average of 2.7%. Similarly, the statistical analysis conducted on geographies consisting of 61,632,600 people shows no correlation between the proportion of Cypriots and percentage of single father households in the United States with a correlation coefficient (R) of 0.021 and weighted average of 1.8%, a difference of 44.8%.
Single Father Households Correlation Summary
| Measurement | Central American Indian | Cypriot |
| Minimum | 0.47% | 0.26% |
| Maximum | 16.1% | 6.4% |
| Range | 15.6% | 6.1% |
| Mean | 4.3% | 1.8% |
| Median | 3.0% | 1.5% |
| Interquartile 25% (IQ1) | 2.5% | 1.1% |
| Interquartile 75% (IQ3) | 5.0% | 2.0% |
| Interquartile Range (IQR) | 2.5% | 0.87% |
| Standard Deviation (Sample) | 3.0% | 1.2% |
| Standard Deviation (Population) | 3.0% | 1.2% |
Similar Demographics by Single Father Households
Demographics Similar to Central American Indians by Single Father Households
In terms of single father households, the demographic groups most similar to Central American Indians are Ottawa (2.7%, a difference of 0.16%), Immigrants from Cuba (2.7%, a difference of 0.16%), Hawaiian (2.7%, a difference of 0.25%), Immigrants from Cambodia (2.7%, a difference of 0.25%), and Immigrants from Nicaragua (2.7%, a difference of 0.31%).
| Demographics | Rating | Rank | Single Father Households |
| Immigrants | Portugal | 0.1 /100 | #280 | Tragic 2.6% |
| Nicaraguans | 0.1 /100 | #281 | Tragic 2.6% |
| Dutch West Indians | 0.1 /100 | #282 | Tragic 2.6% |
| Immigrants | Nicaragua | 0.1 /100 | #283 | Tragic 2.7% |
| Hawaiians | 0.1 /100 | #284 | Tragic 2.7% |
| Ottawa | 0.1 /100 | #285 | Tragic 2.7% |
| Immigrants | Cuba | 0.1 /100 | #286 | Tragic 2.7% |
| Central American Indians | 0.0 /100 | #287 | Tragic 2.7% |
| Immigrants | Cambodia | 0.0 /100 | #288 | Tragic 2.7% |
| Tlingit-Haida | 0.0 /100 | #289 | Tragic 2.7% |
| Puget Sound Salish | 0.0 /100 | #290 | Tragic 2.7% |
| Blackfeet | 0.0 /100 | #291 | Tragic 2.7% |
| Choctaw | 0.0 /100 | #292 | Tragic 2.7% |
| Immigrants | Fiji | 0.0 /100 | #293 | Tragic 2.7% |
| Malaysians | 0.0 /100 | #294 | Tragic 2.7% |
Demographics Similar to Cypriots by Single Father Households
In terms of single father households, the demographic groups most similar to Cypriots are Immigrants from Ireland (1.8%, a difference of 0.11%), Immigrants from Taiwan (1.8%, a difference of 0.16%), Immigrants from China (1.8%, a difference of 0.25%), Immigrants from Hong Kong (1.8%, a difference of 0.52%), and Okinawan (1.9%, a difference of 0.61%).
| Demographics | Rating | Rank | Single Father Households |
| Soviet Union | 100.0 /100 | #1 | Exceptional 1.8% |
| Immigrants | Israel | 100.0 /100 | #2 | Exceptional 1.8% |
| Filipinos | 100.0 /100 | #3 | Exceptional 1.8% |
| Immigrants | Uzbekistan | 100.0 /100 | #4 | Exceptional 1.8% |
| Immigrants | Hong Kong | 100.0 /100 | #5 | Exceptional 1.8% |
| Immigrants | Taiwan | 100.0 /100 | #6 | Exceptional 1.8% |
| Cypriots | 100.0 /100 | #7 | Exceptional 1.8% |
| Immigrants | Ireland | 100.0 /100 | #8 | Exceptional 1.8% |
| Immigrants | China | 100.0 /100 | #9 | Exceptional 1.8% |
| Okinawans | 100.0 /100 | #10 | Exceptional 1.9% |
| Immigrants | Belarus | 100.0 /100 | #11 | Exceptional 1.9% |
| Immigrants | Greece | 100.0 /100 | #12 | Exceptional 1.9% |
| Immigrants | Singapore | 100.0 /100 | #13 | Exceptional 1.9% |
| Immigrants | Lithuania | 100.0 /100 | #14 | Exceptional 1.9% |
| Immigrants | Eastern Asia | 100.0 /100 | #15 | Exceptional 1.9% |