Creek vs Immigrants from Albania Births to Unmarried Women
COMPARE
Creek
Immigrants from Albania
Births to Unmarried Women
Births to Unmarried Women Comparison
Creek
Immigrants from Albania
37.6%
BIRTHS TO UNMARRIED WOMEN
0.0/ 100
METRIC RATING
287th/ 347
METRIC RANK
28.0%
BIRTHS TO UNMARRIED WOMEN
99.2/ 100
METRIC RATING
58th/ 347
METRIC RANK
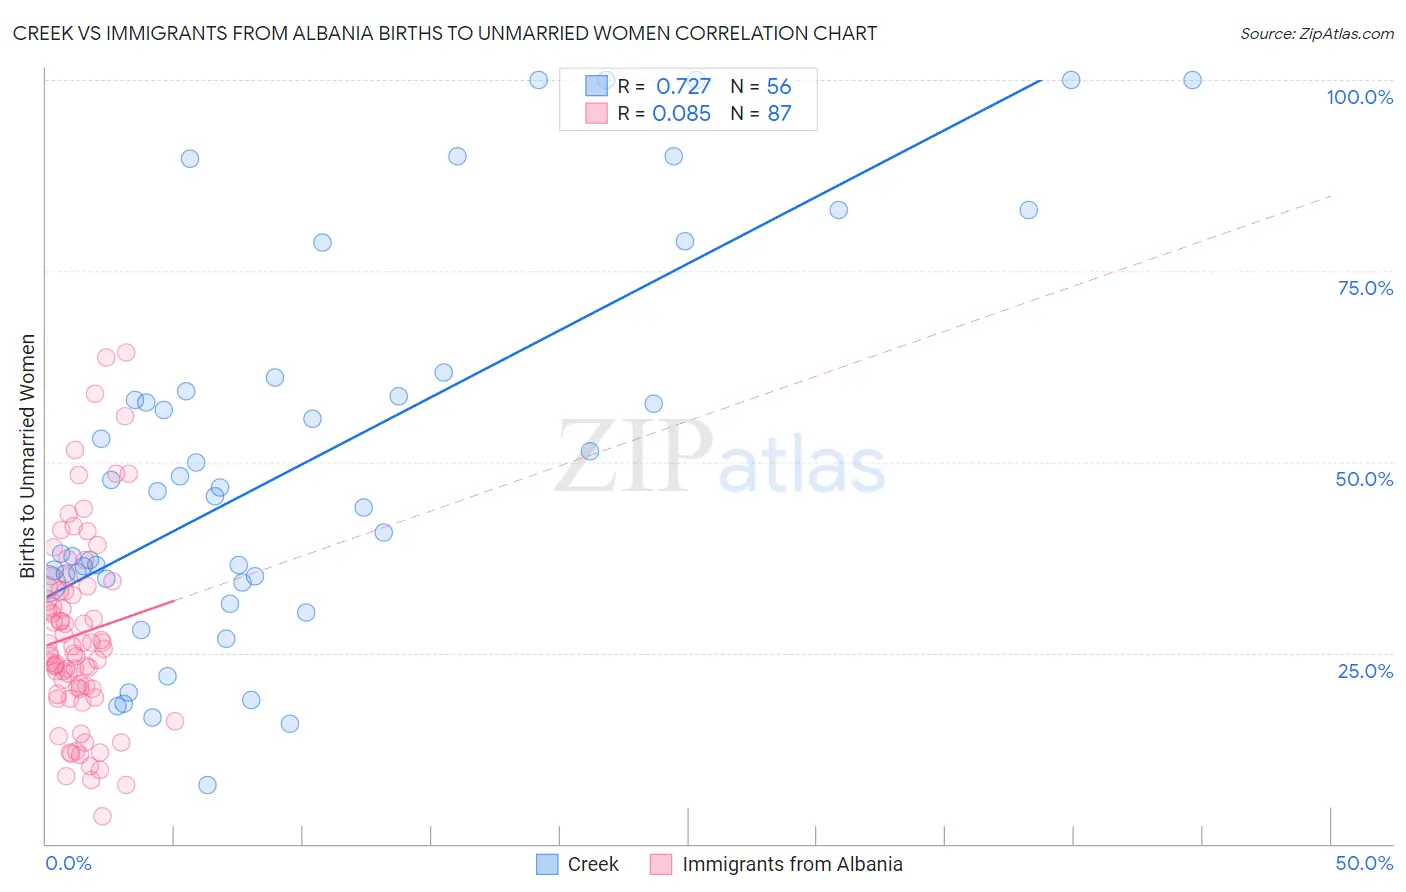
Creek vs Immigrants from Albania Births to Unmarried Women Correlation Chart
The statistical analysis conducted on geographies consisting of 173,524,470 people shows a strong positive correlation between the proportion of Creek and percentage of births to unmarried women in the United States with a correlation coefficient (R) of 0.727 and weighted average of 37.6%. Similarly, the statistical analysis conducted on geographies consisting of 114,601,314 people shows a slight positive correlation between the proportion of Immigrants from Albania and percentage of births to unmarried women in the United States with a correlation coefficient (R) of 0.085 and weighted average of 28.0%, a difference of 33.9%.
Births to Unmarried Women Correlation Summary
| Measurement | Creek | Immigrants from Albania |
| Minimum | 7.7% | 3.6% |
| Maximum | 100.0% | 64.4% |
| Range | 92.3% | 60.8% |
| Mean | 50.2% | 27.4% |
| Median | 45.8% | 25.6% |
| Interquartile 25% (IQ1) | 34.5% | 20.3% |
| Interquartile 75% (IQ3) | 60.2% | 33.6% |
| Interquartile Range (IQR) | 25.7% | 13.3% |
| Standard Deviation (Sample) | 25.3% | 12.6% |
| Standard Deviation (Population) | 25.0% | 12.5% |
Similar Demographics by Births to Unmarried Women
Demographics Similar to Creek by Births to Unmarried Women
In terms of births to unmarried women, the demographic groups most similar to Creek are Immigrants from Liberia (37.6%, a difference of 0.17%), Immigrants from Guatemala (37.5%, a difference of 0.23%), Immigrants from Mexico (37.5%, a difference of 0.25%), Immigrants from Central America (37.4%, a difference of 0.35%), and Alaskan Athabascan (37.7%, a difference of 0.40%).
| Demographics | Rating | Rank | Births to Unmarried Women |
| Immigrants | St. Vincent and the Grenadines | 0.1 /100 | #280 | Tragic 37.3% |
| Immigrants | Belize | 0.1 /100 | #281 | Tragic 37.3% |
| Liberians | 0.0 /100 | #282 | Tragic 37.4% |
| Spanish American Indians | 0.0 /100 | #283 | Tragic 37.4% |
| Immigrants | Central America | 0.0 /100 | #284 | Tragic 37.4% |
| Immigrants | Mexico | 0.0 /100 | #285 | Tragic 37.5% |
| Immigrants | Guatemala | 0.0 /100 | #286 | Tragic 37.5% |
| Creek | 0.0 /100 | #287 | Tragic 37.6% |
| Immigrants | Liberia | 0.0 /100 | #288 | Tragic 37.6% |
| Alaskan Athabascans | 0.0 /100 | #289 | Tragic 37.7% |
| Hispanics or Latinos | 0.0 /100 | #290 | Tragic 37.8% |
| Seminole | 0.0 /100 | #291 | Tragic 37.9% |
| Blackfeet | 0.0 /100 | #292 | Tragic 37.9% |
| Immigrants | Nicaragua | 0.0 /100 | #293 | Tragic 38.0% |
| British West Indians | 0.0 /100 | #294 | Tragic 38.0% |
Demographics Similar to Immigrants from Albania by Births to Unmarried Women
In terms of births to unmarried women, the demographic groups most similar to Immigrants from Albania are Russian (28.0%, a difference of 0.11%), Immigrants from Belgium (28.0%, a difference of 0.24%), Immigrants from Kazakhstan (28.1%, a difference of 0.25%), Immigrants from Turkey (28.1%, a difference of 0.29%), and Immigrants from North Macedonia (28.1%, a difference of 0.34%).
| Demographics | Rating | Rank | Births to Unmarried Women |
| Macedonians | 99.4 /100 | #51 | Exceptional 27.9% |
| Bhutanese | 99.4 /100 | #52 | Exceptional 27.9% |
| Immigrants | Romania | 99.4 /100 | #53 | Exceptional 27.9% |
| Afghans | 99.4 /100 | #54 | Exceptional 27.9% |
| Mongolians | 99.3 /100 | #55 | Exceptional 27.9% |
| Immigrants | Belgium | 99.3 /100 | #56 | Exceptional 28.0% |
| Russians | 99.2 /100 | #57 | Exceptional 28.0% |
| Immigrants | Albania | 99.2 /100 | #58 | Exceptional 28.0% |
| Immigrants | Kazakhstan | 99.1 /100 | #59 | Exceptional 28.1% |
| Immigrants | Turkey | 99.1 /100 | #60 | Exceptional 28.1% |
| Immigrants | North Macedonia | 99.1 /100 | #61 | Exceptional 28.1% |
| Egyptians | 99.0 /100 | #62 | Exceptional 28.2% |
| Immigrants | Serbia | 98.9 /100 | #63 | Exceptional 28.3% |
| Tongans | 98.8 /100 | #64 | Exceptional 28.4% |
| Immigrants | Czechoslovakia | 98.8 /100 | #65 | Exceptional 28.4% |