Costa Rican vs Colombian Married-couple Households
COMPARE
Costa Rican
Colombian
Married-couple Households
Married-couple Households Comparison
Costa Ricans
Colombians
47.2%
MARRIED-COUPLE HOUSEHOLDS
84.4/ 100
METRIC RATING
141st/ 347
METRIC RANK
46.8%
MARRIED-COUPLE HOUSEHOLDS
71.0/ 100
METRIC RATING
162nd/ 347
METRIC RANK
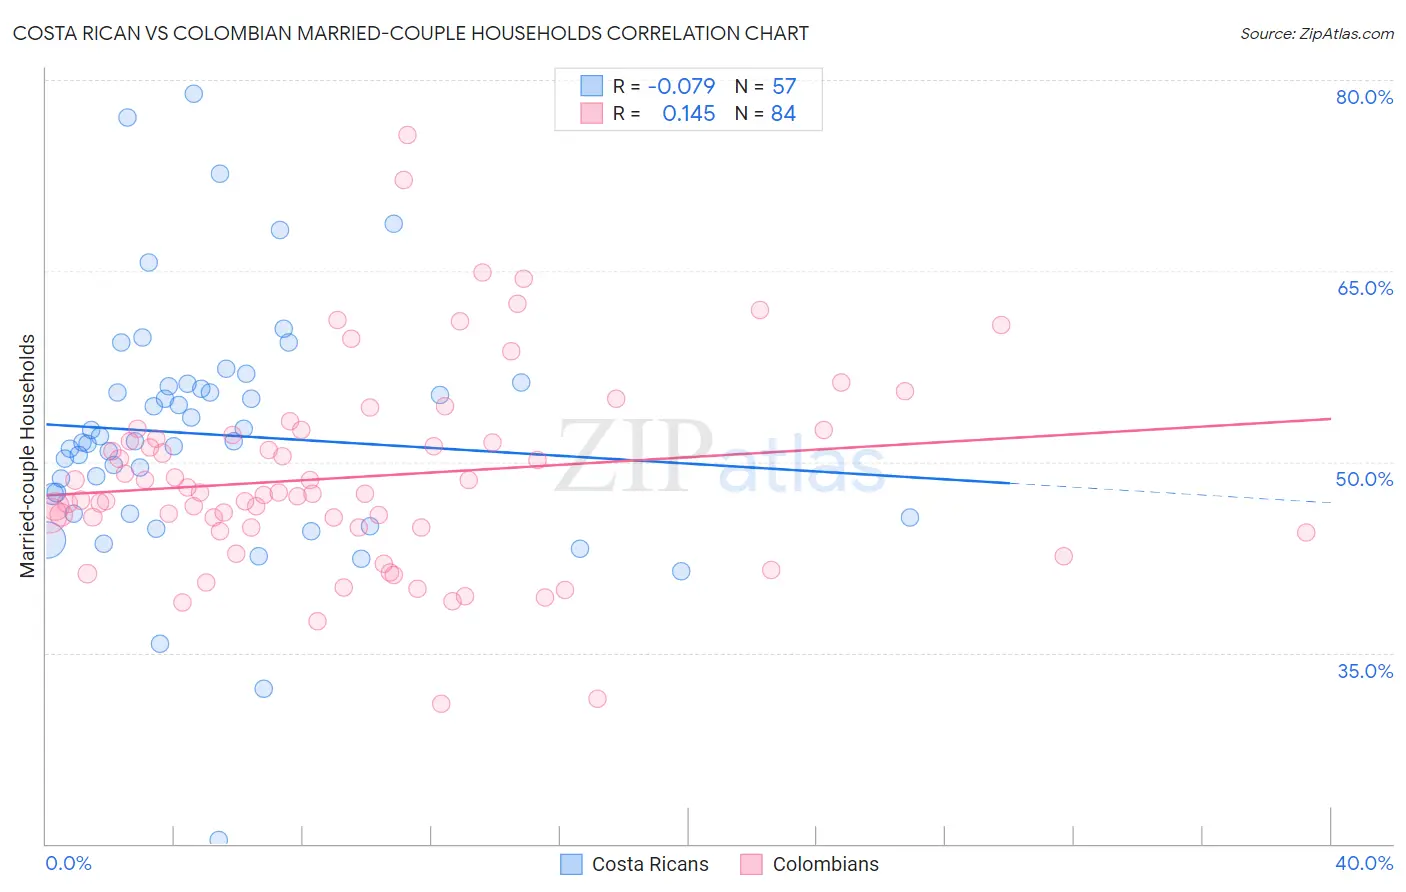
Costa Rican vs Colombian Married-couple Households Correlation Chart
The statistical analysis conducted on geographies consisting of 253,452,851 people shows a slight negative correlation between the proportion of Costa Ricans and percentage of married-couple family households in the United States with a correlation coefficient (R) of -0.079 and weighted average of 47.2%. Similarly, the statistical analysis conducted on geographies consisting of 419,302,145 people shows a poor positive correlation between the proportion of Colombians and percentage of married-couple family households in the United States with a correlation coefficient (R) of 0.145 and weighted average of 46.8%, a difference of 0.74%.
Married-couple Households Correlation Summary
| Measurement | Costa Rican | Colombian |
| Minimum | 20.3% | 31.0% |
| Maximum | 78.9% | 75.7% |
| Range | 58.6% | 44.7% |
| Mean | 52.2% | 48.8% |
| Median | 51.6% | 47.5% |
| Interquartile 25% (IQ1) | 45.9% | 44.8% |
| Interquartile 75% (IQ3) | 56.0% | 51.9% |
| Interquartile Range (IQR) | 10.1% | 7.1% |
| Standard Deviation (Sample) | 9.9% | 7.8% |
| Standard Deviation (Population) | 9.8% | 7.8% |
Similar Demographics by Married-couple Households
Demographics Similar to Costa Ricans by Married-couple Households
In terms of married-couple households, the demographic groups most similar to Costa Ricans are Spanish (47.2%, a difference of 0.0%), Immigrants from Sweden (47.2%, a difference of 0.020%), Spaniard (47.2%, a difference of 0.020%), Immigrants from Belarus (47.2%, a difference of 0.040%), and Immigrants from Afghanistan (47.2%, a difference of 0.050%).
| Demographics | Rating | Rank | Married-couple Households |
| Immigrants | Greece | 86.0 /100 | #134 | Excellent 47.2% |
| Immigrants | Argentina | 86.0 /100 | #135 | Excellent 47.2% |
| New Zealanders | 85.3 /100 | #136 | Excellent 47.2% |
| Immigrants | Malaysia | 85.2 /100 | #137 | Excellent 47.2% |
| Immigrants | Afghanistan | 85.1 /100 | #138 | Excellent 47.2% |
| Immigrants | Sweden | 84.7 /100 | #139 | Excellent 47.2% |
| Spanish | 84.5 /100 | #140 | Excellent 47.2% |
| Costa Ricans | 84.4 /100 | #141 | Excellent 47.2% |
| Spaniards | 84.1 /100 | #142 | Excellent 47.2% |
| Immigrants | Belarus | 83.8 /100 | #143 | Excellent 47.2% |
| Mexicans | 83.4 /100 | #144 | Excellent 47.1% |
| Slovenes | 81.7 /100 | #145 | Excellent 47.1% |
| Immigrants | Western Europe | 81.6 /100 | #146 | Excellent 47.1% |
| Immigrants | Syria | 81.6 /100 | #147 | Excellent 47.1% |
| Icelanders | 79.5 /100 | #148 | Good 47.0% |
Demographics Similar to Colombians by Married-couple Households
In terms of married-couple households, the demographic groups most similar to Colombians are Delaware (46.8%, a difference of 0.010%), Iraqi (46.9%, a difference of 0.030%), Immigrants from Turkey (46.8%, a difference of 0.040%), Immigrants from Kazakhstan (46.8%, a difference of 0.050%), and Immigrants from Southern Europe (46.8%, a difference of 0.050%).
| Demographics | Rating | Rank | Married-couple Households |
| Arabs | 76.0 /100 | #155 | Good 46.9% |
| Armenians | 75.4 /100 | #156 | Good 46.9% |
| Immigrants | Oceania | 74.8 /100 | #157 | Good 46.9% |
| Immigrants | Nonimmigrants | 73.3 /100 | #158 | Good 46.9% |
| Osage | 73.2 /100 | #159 | Good 46.9% |
| Iraqis | 71.7 /100 | #160 | Good 46.9% |
| Delaware | 71.2 /100 | #161 | Good 46.8% |
| Colombians | 71.0 /100 | #162 | Good 46.8% |
| Immigrants | Turkey | 70.2 /100 | #163 | Good 46.8% |
| Immigrants | Kazakhstan | 70.0 /100 | #164 | Good 46.8% |
| Immigrants | Southern Europe | 69.9 /100 | #165 | Good 46.8% |
| Cherokee | 65.7 /100 | #166 | Good 46.7% |
| Immigrants | Croatia | 64.2 /100 | #167 | Good 46.7% |
| Israelis | 62.3 /100 | #168 | Good 46.7% |
| Spanish American Indians | 59.4 /100 | #169 | Average 46.6% |