Comanche vs Ottawa Divorced or Separated
COMPARE
Comanche
Ottawa
Divorced or Separated
Divorced or Separated Comparison
Comanche
Ottawa
13.5%
DIVORCED OR SEPARATED
0.0/ 100
METRIC RATING
327th/ 347
METRIC RANK
13.2%
DIVORCED OR SEPARATED
0.0/ 100
METRIC RATING
308th/ 347
METRIC RANK
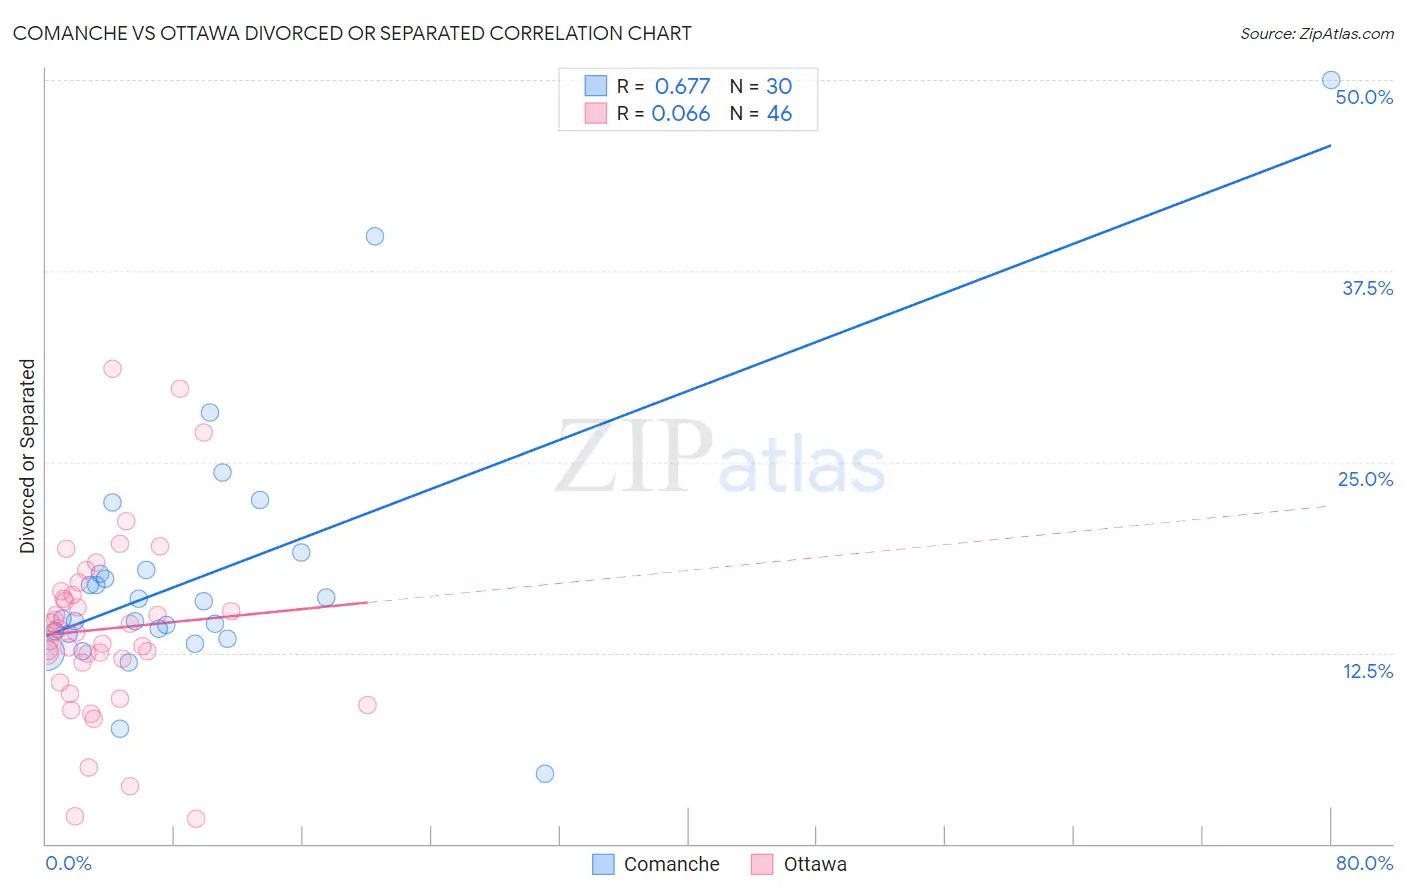
Comanche vs Ottawa Divorced or Separated Correlation Chart
The statistical analysis conducted on geographies consisting of 109,776,107 people shows a significant positive correlation between the proportion of Comanche and percentage of population currently divorced or separated in the United States with a correlation coefficient (R) of 0.677 and weighted average of 13.5%. Similarly, the statistical analysis conducted on geographies consisting of 49,956,568 people shows a slight positive correlation between the proportion of Ottawa and percentage of population currently divorced or separated in the United States with a correlation coefficient (R) of 0.066 and weighted average of 13.2%, a difference of 2.2%.
Divorced or Separated Correlation Summary
| Measurement | Comanche | Ottawa |
| Minimum | 4.6% | 1.6% |
| Maximum | 50.0% | 31.1% |
| Range | 45.4% | 29.5% |
| Mean | 17.7% | 14.1% |
| Median | 15.3% | 13.8% |
| Interquartile 25% (IQ1) | 13.7% | 11.9% |
| Interquartile 75% (IQ3) | 18.0% | 16.3% |
| Interquartile Range (IQR) | 4.2% | 4.4% |
| Standard Deviation (Sample) | 8.8% | 6.0% |
| Standard Deviation (Population) | 8.6% | 5.9% |
Demographics Similar to Comanche and Ottawa by Divorced or Separated
In terms of divorced or separated, the demographic groups most similar to Comanche are Immigrants from Congo (13.5%, a difference of 0.48%), Potawatomi (13.5%, a difference of 0.49%), Osage (13.4%, a difference of 0.55%), U.S. Virgin Islander (13.4%, a difference of 0.63%), and Immigrants from Haiti (13.4%, a difference of 0.85%). Similarly, the demographic groups most similar to Ottawa are American (13.2%, a difference of 0.010%), African (13.2%, a difference of 0.030%), Sioux (13.2%, a difference of 0.050%), French American Indian (13.2%, a difference of 0.090%), and Blackfeet (13.3%, a difference of 0.40%).
| Demographics | Rating | Rank | Divorced or Separated |
| French American Indians | 0.0 /100 | #307 | Tragic 13.2% |
| Ottawa | 0.0 /100 | #308 | Tragic 13.2% |
| Americans | 0.0 /100 | #309 | Tragic 13.2% |
| Africans | 0.0 /100 | #310 | Tragic 13.2% |
| Sioux | 0.0 /100 | #311 | Tragic 13.2% |
| Blackfeet | 0.0 /100 | #312 | Tragic 13.3% |
| Immigrants | Nicaragua | 0.0 /100 | #313 | Tragic 13.3% |
| Yaqui | 0.0 /100 | #314 | Tragic 13.3% |
| Spanish Americans | 0.0 /100 | #315 | Tragic 13.3% |
| Tsimshian | 0.0 /100 | #316 | Tragic 13.3% |
| Haitians | 0.0 /100 | #317 | Tragic 13.3% |
| Cree | 0.0 /100 | #318 | Tragic 13.4% |
| Puget Sound Salish | 0.0 /100 | #319 | Tragic 13.4% |
| Cajuns | 0.0 /100 | #320 | Tragic 13.4% |
| Cheyenne | 0.0 /100 | #321 | Tragic 13.4% |
| Immigrants | Haiti | 0.0 /100 | #322 | Tragic 13.4% |
| U.S. Virgin Islanders | 0.0 /100 | #323 | Tragic 13.4% |
| Osage | 0.0 /100 | #324 | Tragic 13.4% |
| Potawatomi | 0.0 /100 | #325 | Tragic 13.5% |
| Immigrants | Congo | 0.0 /100 | #326 | Tragic 13.5% |
| Comanche | 0.0 /100 | #327 | Tragic 13.5% |