Comanche vs French American Indian Divorced or Separated
COMPARE
Comanche
French American Indian
Divorced or Separated
Divorced or Separated Comparison
Comanche
French American Indians
13.5%
DIVORCED OR SEPARATED
0.0/ 100
METRIC RATING
327th/ 347
METRIC RANK
13.2%
DIVORCED OR SEPARATED
0.0/ 100
METRIC RATING
307th/ 347
METRIC RANK
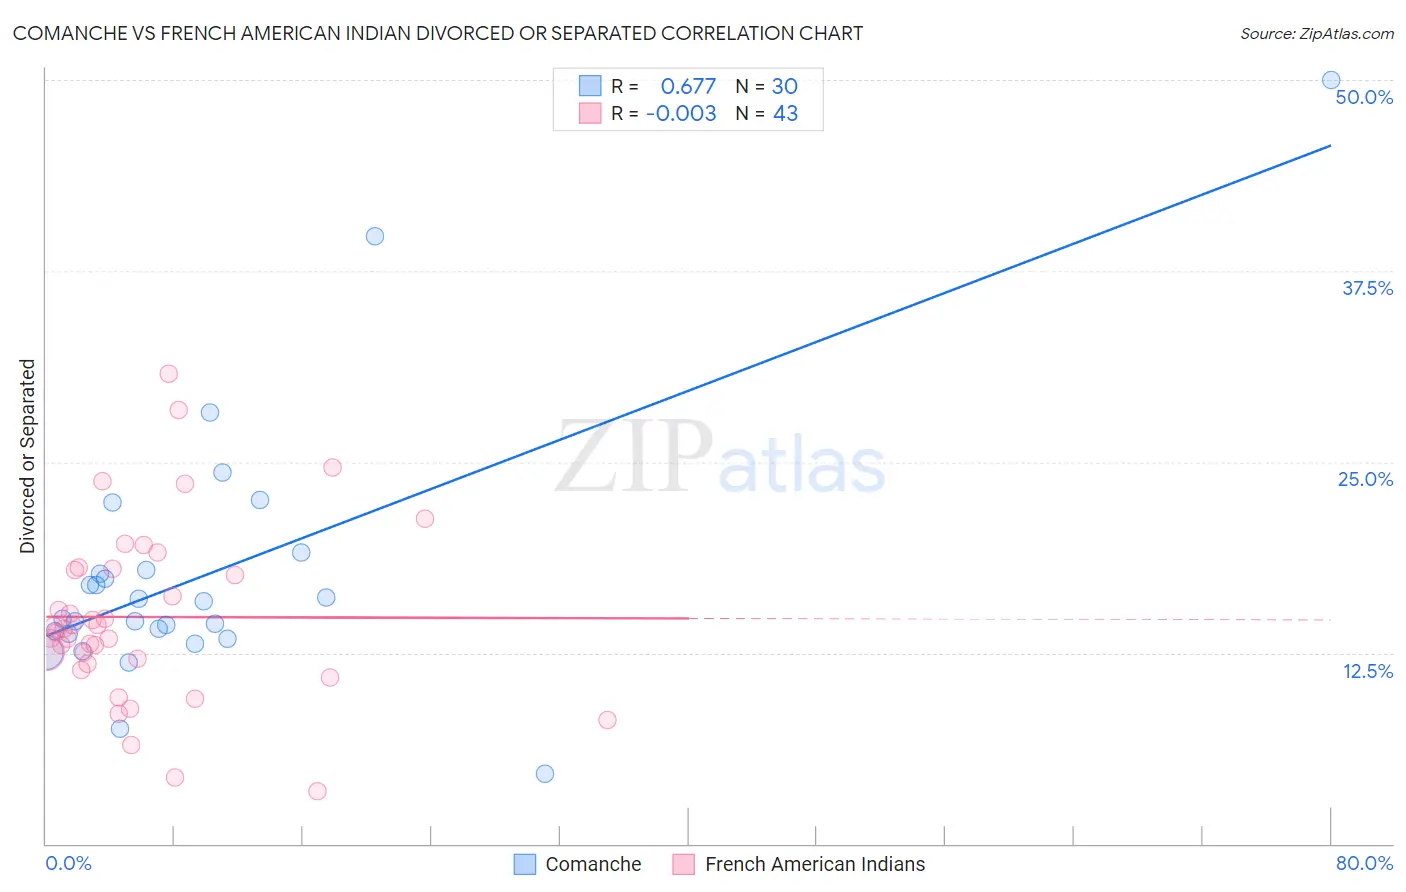
Comanche vs French American Indian Divorced or Separated Correlation Chart
The statistical analysis conducted on geographies consisting of 109,776,107 people shows a significant positive correlation between the proportion of Comanche and percentage of population currently divorced or separated in the United States with a correlation coefficient (R) of 0.677 and weighted average of 13.5%. Similarly, the statistical analysis conducted on geographies consisting of 131,970,450 people shows no correlation between the proportion of French American Indians and percentage of population currently divorced or separated in the United States with a correlation coefficient (R) of -0.003 and weighted average of 13.2%, a difference of 2.3%.
Divorced or Separated Correlation Summary
| Measurement | Comanche | French American Indian |
| Minimum | 4.6% | 3.4% |
| Maximum | 50.0% | 30.8% |
| Range | 45.4% | 27.4% |
| Mean | 17.7% | 14.8% |
| Median | 15.3% | 14.1% |
| Interquartile 25% (IQ1) | 13.7% | 11.8% |
| Interquartile 75% (IQ3) | 18.0% | 18.0% |
| Interquartile Range (IQR) | 4.2% | 6.2% |
| Standard Deviation (Sample) | 8.8% | 5.8% |
| Standard Deviation (Population) | 8.6% | 5.7% |
Demographics Similar to Comanche and French American Indians by Divorced or Separated
In terms of divorced or separated, the demographic groups most similar to Comanche are Immigrants from Congo (13.5%, a difference of 0.48%), Potawatomi (13.5%, a difference of 0.49%), Osage (13.4%, a difference of 0.55%), U.S. Virgin Islander (13.4%, a difference of 0.63%), and Immigrants from Haiti (13.4%, a difference of 0.85%). Similarly, the demographic groups most similar to French American Indians are Ottawa (13.2%, a difference of 0.090%), American (13.2%, a difference of 0.10%), African (13.2%, a difference of 0.12%), Sioux (13.2%, a difference of 0.14%), and Blackfeet (13.3%, a difference of 0.49%).
| Demographics | Rating | Rank | Divorced or Separated |
| French American Indians | 0.0 /100 | #307 | Tragic 13.2% |
| Ottawa | 0.0 /100 | #308 | Tragic 13.2% |
| Americans | 0.0 /100 | #309 | Tragic 13.2% |
| Africans | 0.0 /100 | #310 | Tragic 13.2% |
| Sioux | 0.0 /100 | #311 | Tragic 13.2% |
| Blackfeet | 0.0 /100 | #312 | Tragic 13.3% |
| Immigrants | Nicaragua | 0.0 /100 | #313 | Tragic 13.3% |
| Yaqui | 0.0 /100 | #314 | Tragic 13.3% |
| Spanish Americans | 0.0 /100 | #315 | Tragic 13.3% |
| Tsimshian | 0.0 /100 | #316 | Tragic 13.3% |
| Haitians | 0.0 /100 | #317 | Tragic 13.3% |
| Cree | 0.0 /100 | #318 | Tragic 13.4% |
| Puget Sound Salish | 0.0 /100 | #319 | Tragic 13.4% |
| Cajuns | 0.0 /100 | #320 | Tragic 13.4% |
| Cheyenne | 0.0 /100 | #321 | Tragic 13.4% |
| Immigrants | Haiti | 0.0 /100 | #322 | Tragic 13.4% |
| U.S. Virgin Islanders | 0.0 /100 | #323 | Tragic 13.4% |
| Osage | 0.0 /100 | #324 | Tragic 13.4% |
| Potawatomi | 0.0 /100 | #325 | Tragic 13.5% |
| Immigrants | Congo | 0.0 /100 | #326 | Tragic 13.5% |
| Comanche | 0.0 /100 | #327 | Tragic 13.5% |