Cherokee vs Cambodian Family Households
COMPARE
Cherokee
Cambodian
Family Households
Family Households Comparison
Cherokee
Cambodians
65.0%
FAMILY HOUSEHOLDS
95.3/ 100
METRIC RATING
117th/ 347
METRIC RANK
61.4%
FAMILY HOUSEHOLDS
0.0/ 100
METRIC RATING
329th/ 347
METRIC RANK
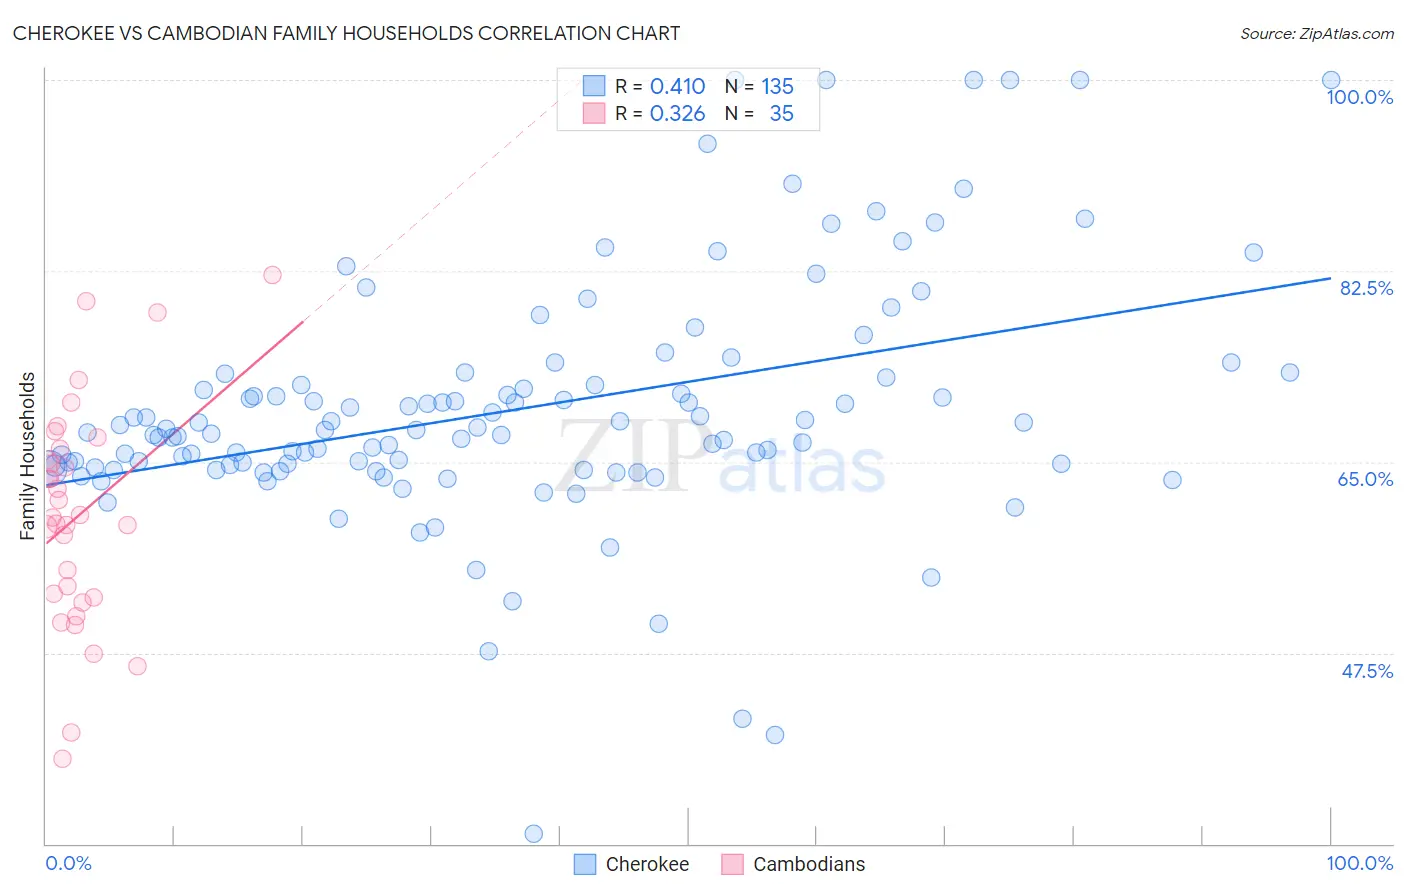
Cherokee vs Cambodian Family Households Correlation Chart
The statistical analysis conducted on geographies consisting of 493,383,151 people shows a moderate positive correlation between the proportion of Cherokee and percentage of family households in the United States with a correlation coefficient (R) of 0.410 and weighted average of 65.0%. Similarly, the statistical analysis conducted on geographies consisting of 102,469,130 people shows a mild positive correlation between the proportion of Cambodians and percentage of family households in the United States with a correlation coefficient (R) of 0.326 and weighted average of 61.4%, a difference of 5.8%.
Family Households Correlation Summary
| Measurement | Cherokee | Cambodian |
| Minimum | 31.0% | 37.8% |
| Maximum | 100.0% | 82.2% |
| Range | 69.0% | 44.4% |
| Mean | 69.9% | 60.1% |
| Median | 67.9% | 59.9% |
| Interquartile 25% (IQ1) | 64.5% | 52.6% |
| Interquartile 75% (IQ3) | 72.7% | 66.2% |
| Interquartile Range (IQR) | 8.2% | 13.6% |
| Standard Deviation (Sample) | 11.2% | 10.2% |
| Standard Deviation (Population) | 11.2% | 10.1% |
Similar Demographics by Family Households
Demographics Similar to Cherokee by Family Households
In terms of family households, the demographic groups most similar to Cherokee are Immigrants from Iraq (65.0%, a difference of 0.0%), Ecuadorian (65.0%, a difference of 0.010%), Dutch (64.9%, a difference of 0.020%), Argentinean (65.0%, a difference of 0.030%), and Immigrants from Eastern Asia (64.9%, a difference of 0.060%).
| Demographics | Rating | Rank | Family Households |
| Scandinavians | 96.8 /100 | #110 | Exceptional 65.0% |
| Europeans | 96.8 /100 | #111 | Exceptional 65.0% |
| Immigrants | Jordan | 96.5 /100 | #112 | Exceptional 65.0% |
| Spanish | 96.2 /100 | #113 | Exceptional 65.0% |
| Argentineans | 95.7 /100 | #114 | Exceptional 65.0% |
| Ecuadorians | 95.4 /100 | #115 | Exceptional 65.0% |
| Immigrants | Iraq | 95.4 /100 | #116 | Exceptional 65.0% |
| Cherokee | 95.3 /100 | #117 | Exceptional 65.0% |
| Dutch | 95.1 /100 | #118 | Exceptional 64.9% |
| Immigrants | Eastern Asia | 94.4 /100 | #119 | Exceptional 64.9% |
| Immigrants | Oceania | 94.2 /100 | #120 | Exceptional 64.9% |
| Hungarians | 94.0 /100 | #121 | Exceptional 64.9% |
| Hmong | 93.4 /100 | #122 | Exceptional 64.9% |
| Choctaw | 93.4 /100 | #123 | Exceptional 64.9% |
| Immigrants | Argentina | 92.8 /100 | #124 | Exceptional 64.9% |
Demographics Similar to Cambodians by Family Households
In terms of family households, the demographic groups most similar to Cambodians are Kiowa (61.4%, a difference of 0.030%), Immigrants from Australia (61.3%, a difference of 0.14%), Immigrants from France (61.3%, a difference of 0.14%), Black/African American (61.5%, a difference of 0.15%), and Indonesian (61.5%, a difference of 0.18%).
| Demographics | Rating | Rank | Family Households |
| Immigrants | Serbia | 0.0 /100 | #322 | Tragic 61.6% |
| Tlingit-Haida | 0.0 /100 | #323 | Tragic 61.6% |
| Immigrants | West Indies | 0.0 /100 | #324 | Tragic 61.6% |
| Immigrants | Switzerland | 0.0 /100 | #325 | Tragic 61.6% |
| Indonesians | 0.0 /100 | #326 | Tragic 61.5% |
| Blacks/African Americans | 0.0 /100 | #327 | Tragic 61.5% |
| Kiowa | 0.0 /100 | #328 | Tragic 61.4% |
| Cambodians | 0.0 /100 | #329 | Tragic 61.4% |
| Immigrants | Australia | 0.0 /100 | #330 | Tragic 61.3% |
| Immigrants | France | 0.0 /100 | #331 | Tragic 61.3% |
| Ethiopians | 0.0 /100 | #332 | Tragic 61.2% |
| Immigrants | Ethiopia | 0.0 /100 | #333 | Tragic 61.2% |
| Immigrants | Eastern Africa | 0.0 /100 | #334 | Tragic 61.1% |
| Carpatho Rusyns | 0.0 /100 | #335 | Tragic 61.1% |
| German Russians | 0.0 /100 | #336 | Tragic 60.9% |