Central American vs Houma Married-couple Households
COMPARE
Central American
Houma
Married-couple Households
Married-couple Households Comparison
Central Americans
Houma
43.9%
MARRIED-COUPLE HOUSEHOLDS
0.3/ 100
METRIC RATING
253rd/ 347
METRIC RANK
44.6%
MARRIED-COUPLE HOUSEHOLDS
1.5/ 100
METRIC RATING
231st/ 347
METRIC RANK
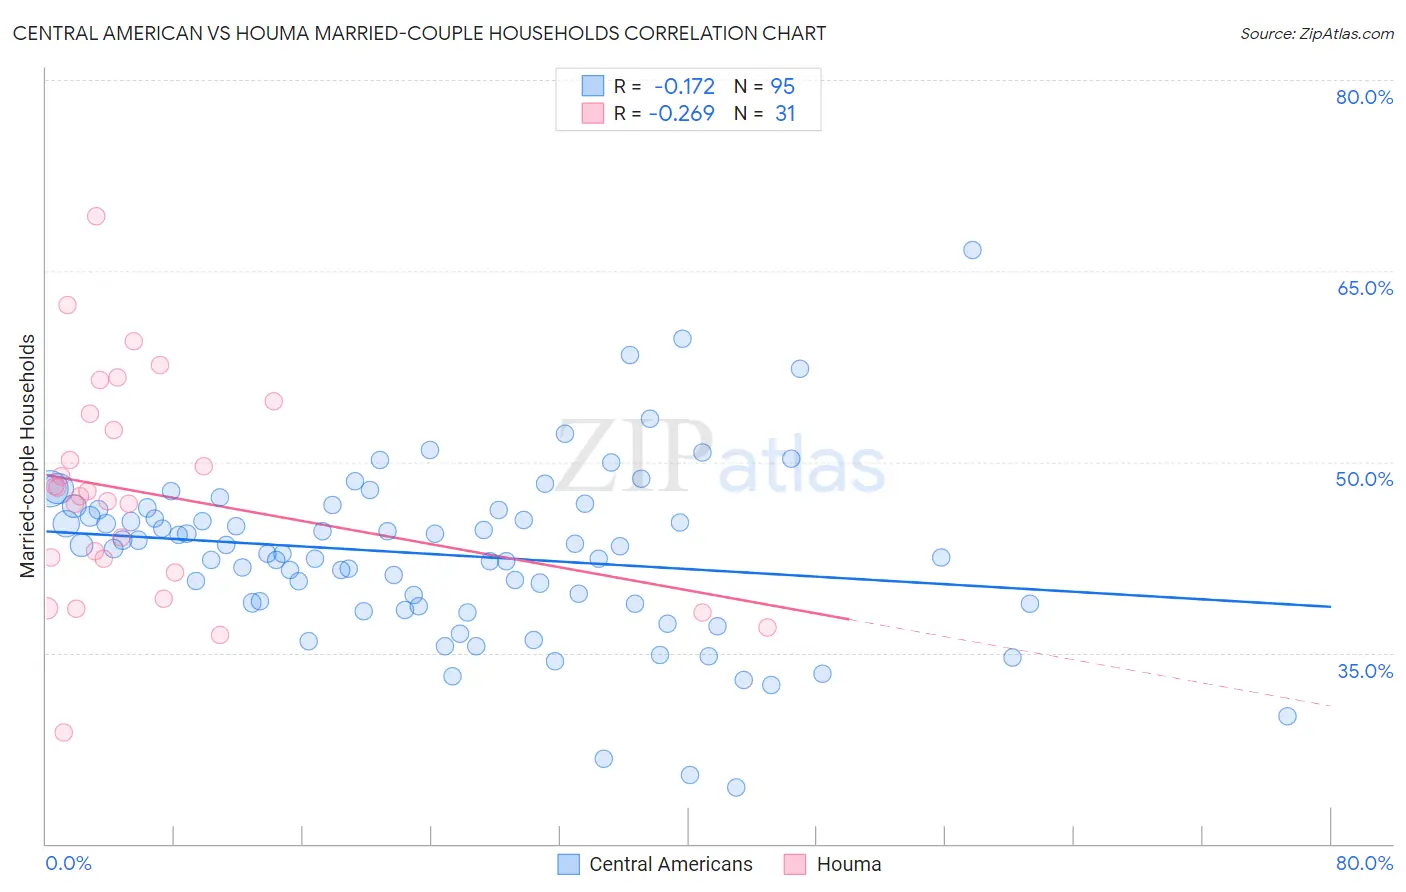
Central American vs Houma Married-couple Households Correlation Chart
The statistical analysis conducted on geographies consisting of 504,046,022 people shows a poor negative correlation between the proportion of Central Americans and percentage of married-couple family households in the United States with a correlation coefficient (R) of -0.172 and weighted average of 43.9%. Similarly, the statistical analysis conducted on geographies consisting of 36,791,862 people shows a weak negative correlation between the proportion of Houma and percentage of married-couple family households in the United States with a correlation coefficient (R) of -0.269 and weighted average of 44.6%, a difference of 1.6%.
Married-couple Households Correlation Summary
| Measurement | Central American | Houma |
| Minimum | 24.4% | 28.8% |
| Maximum | 66.7% | 69.3% |
| Range | 42.3% | 40.6% |
| Mean | 42.7% | 47.5% |
| Median | 43.2% | 47.3% |
| Interquartile 25% (IQ1) | 38.9% | 41.3% |
| Interquartile 75% (IQ3) | 46.2% | 53.8% |
| Interquartile Range (IQR) | 7.3% | 12.5% |
| Standard Deviation (Sample) | 6.8% | 8.7% |
| Standard Deviation (Population) | 6.8% | 8.5% |
Similar Demographics by Married-couple Households
Demographics Similar to Central Americans by Married-couple Households
In terms of married-couple households, the demographic groups most similar to Central Americans are Apache (43.9%, a difference of 0.050%), Shoshone (43.9%, a difference of 0.070%), Seminole (44.0%, a difference of 0.12%), German Russian (44.0%, a difference of 0.19%), and Ugandan (43.8%, a difference of 0.21%).
| Demographics | Rating | Rank | Married-couple Households |
| Immigrants | Cuba | 0.6 /100 | #246 | Tragic 44.2% |
| Immigrants | Morocco | 0.6 /100 | #247 | Tragic 44.2% |
| Yup'ik | 0.4 /100 | #248 | Tragic 44.1% |
| Immigrants | Kenya | 0.4 /100 | #249 | Tragic 44.1% |
| French American Indians | 0.4 /100 | #250 | Tragic 44.1% |
| German Russians | 0.4 /100 | #251 | Tragic 44.0% |
| Seminole | 0.4 /100 | #252 | Tragic 44.0% |
| Central Americans | 0.3 /100 | #253 | Tragic 43.9% |
| Apache | 0.3 /100 | #254 | Tragic 43.9% |
| Shoshone | 0.3 /100 | #255 | Tragic 43.9% |
| Ugandans | 0.3 /100 | #256 | Tragic 43.8% |
| Blackfeet | 0.2 /100 | #257 | Tragic 43.8% |
| Central American Indians | 0.2 /100 | #258 | Tragic 43.8% |
| Iroquois | 0.2 /100 | #259 | Tragic 43.7% |
| Immigrants | Cameroon | 0.2 /100 | #260 | Tragic 43.7% |
Demographics Similar to Houma by Married-couple Households
In terms of married-couple households, the demographic groups most similar to Houma are Marshallese (44.6%, a difference of 0.0%), Soviet Union (44.6%, a difference of 0.010%), Immigrants from Uganda (44.6%, a difference of 0.040%), Immigrants from Latin America (44.7%, a difference of 0.050%), and Kenyan (44.7%, a difference of 0.10%).
| Demographics | Rating | Rank | Married-couple Households |
| Immigrants | Micronesia | 2.6 /100 | #224 | Tragic 44.9% |
| Dutch West Indians | 2.6 /100 | #225 | Tragic 44.9% |
| Alsatians | 2.3 /100 | #226 | Tragic 44.8% |
| Salvadorans | 1.9 /100 | #227 | Tragic 44.7% |
| Kenyans | 1.7 /100 | #228 | Tragic 44.7% |
| Immigrants | Latin America | 1.6 /100 | #229 | Tragic 44.7% |
| Soviet Union | 1.6 /100 | #230 | Tragic 44.6% |
| Houma | 1.5 /100 | #231 | Tragic 44.6% |
| Marshallese | 1.5 /100 | #232 | Tragic 44.6% |
| Immigrants | Uganda | 1.5 /100 | #233 | Tragic 44.6% |
| Immigrants | Panama | 1.3 /100 | #234 | Tragic 44.6% |
| Immigrants | Nicaragua | 1.2 /100 | #235 | Tragic 44.5% |
| Yaqui | 1.2 /100 | #236 | Tragic 44.5% |
| Comanche | 1.2 /100 | #237 | Tragic 44.5% |
| Immigrants | Uruguay | 1.1 /100 | #238 | Tragic 44.5% |