Central American Indian vs Tohono O'odham Average Family Size
COMPARE
Central American Indian
Tohono O'odham
Average Family Size
Average Family Size Comparison
Central American Indians
Tohono O'odham
3.35
AVERAGE FAMILY SIZE
100.0/ 100
METRIC RATING
61st/ 347
METRIC RANK
3.53
AVERAGE FAMILY SIZE
100.0/ 100
METRIC RATING
11th/ 347
METRIC RANK
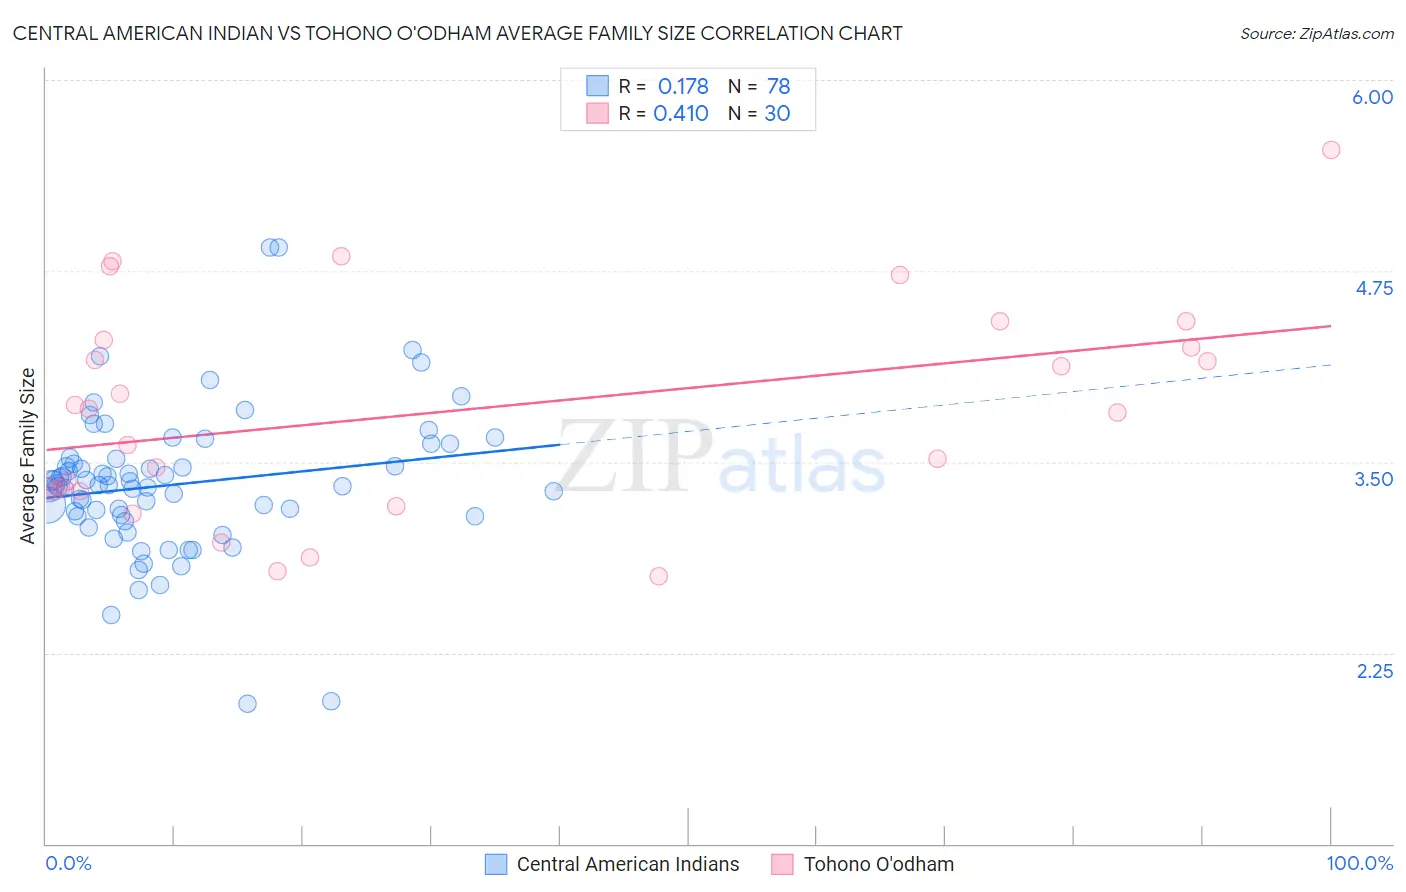
Central American Indian vs Tohono O'odham Average Family Size Correlation Chart
The statistical analysis conducted on geographies consisting of 326,061,161 people shows a poor positive correlation between the proportion of Central American Indians and average family size in the United States with a correlation coefficient (R) of 0.178 and weighted average of 3.35. Similarly, the statistical analysis conducted on geographies consisting of 58,718,905 people shows a moderate positive correlation between the proportion of Tohono O'odham and average family size in the United States with a correlation coefficient (R) of 0.410 and weighted average of 3.53, a difference of 5.6%.
Average Family Size Correlation Summary
| Measurement | Central American Indian | Tohono O'odham |
| Minimum | 1.92 | 2.75 |
| Maximum | 4.90 | 5.54 |
| Range | 2.98 | 2.79 |
| Mean | 3.35 | 3.83 |
| Median | 3.35 | 3.84 |
| Interquartile 25% (IQ1) | 3.15 | 3.31 |
| Interquartile 75% (IQ3) | 3.52 | 4.30 |
| Interquartile Range (IQR) | 0.37 | 0.99 |
| Standard Deviation (Sample) | 0.48 | 0.70 |
| Standard Deviation (Population) | 0.48 | 0.69 |
Similar Demographics by Average Family Size
Demographics Similar to Central American Indians by Average Family Size
In terms of average family size, the demographic groups most similar to Central American Indians are Immigrants from Armenia (3.35, a difference of 0.030%), Japanese (3.35, a difference of 0.050%), Honduran (3.35, a difference of 0.14%), Sri Lankan (3.35, a difference of 0.15%), and Immigrants from Grenada (3.34, a difference of 0.19%).
| Demographics | Rating | Rank | Average Family Size |
| Immigrants | South Eastern Asia | 100.0 /100 | #54 | Exceptional 3.36 |
| Immigrants | Honduras | 100.0 /100 | #55 | Exceptional 3.36 |
| Immigrants | Dominican Republic | 100.0 /100 | #56 | Exceptional 3.35 |
| Sri Lankans | 100.0 /100 | #57 | Exceptional 3.35 |
| Hondurans | 100.0 /100 | #58 | Exceptional 3.35 |
| Japanese | 100.0 /100 | #59 | Exceptional 3.35 |
| Immigrants | Armenia | 100.0 /100 | #60 | Exceptional 3.35 |
| Central American Indians | 100.0 /100 | #61 | Exceptional 3.35 |
| Immigrants | Grenada | 100.0 /100 | #62 | Exceptional 3.34 |
| Chinese | 100.0 /100 | #63 | Exceptional 3.34 |
| Dominicans | 99.9 /100 | #64 | Exceptional 3.34 |
| Immigrants | Laos | 99.9 /100 | #65 | Exceptional 3.34 |
| Immigrants | St. Vincent and the Grenadines | 99.9 /100 | #66 | Exceptional 3.34 |
| Immigrants | Jamaica | 99.9 /100 | #67 | Exceptional 3.33 |
| Immigrants | Cambodia | 99.9 /100 | #68 | Exceptional 3.33 |
Demographics Similar to Tohono O'odham by Average Family Size
In terms of average family size, the demographic groups most similar to Tohono O'odham are Immigrants from Mexico (3.52, a difference of 0.42%), Sioux (3.52, a difference of 0.50%), Immigrants from Central America (3.49, a difference of 1.1%), Tongan (3.49, a difference of 1.2%), and Ute (3.49, a difference of 1.2%).
| Demographics | Rating | Rank | Average Family Size |
| Pima | 100 /100 | #4 | Exceptional 3.75 |
| Navajo | 100.0 /100 | #5 | Exceptional 3.65 |
| Arapaho | 100.0 /100 | #6 | Exceptional 3.64 |
| Inupiat | 100.0 /100 | #7 | Exceptional 3.63 |
| Immigrants | Yemen | 100.0 /100 | #8 | Exceptional 3.60 |
| Hopi | 100.0 /100 | #9 | Exceptional 3.60 |
| Spanish American Indians | 100.0 /100 | #10 | Exceptional 3.58 |
| Tohono O'odham | 100.0 /100 | #11 | Exceptional 3.53 |
| Immigrants | Mexico | 100.0 /100 | #12 | Exceptional 3.52 |
| Sioux | 100.0 /100 | #13 | Exceptional 3.52 |
| Immigrants | Central America | 100.0 /100 | #14 | Exceptional 3.49 |
| Tongans | 100.0 /100 | #15 | Exceptional 3.49 |
| Ute | 100.0 /100 | #16 | Exceptional 3.49 |
| Immigrants | El Salvador | 100.0 /100 | #17 | Exceptional 3.49 |
| Salvadorans | 100.0 /100 | #18 | Exceptional 3.48 |