Central American Indian vs Tohono O'odham 2nd Grade
COMPARE
Central American Indian
Tohono O'odham
2nd Grade
2nd Grade Comparison
Central American Indians
Tohono O'odham
97.0%
2ND GRADE
0.0/ 100
METRIC RATING
301st/ 347
METRIC RANK
97.8%
2ND GRADE
20.9/ 100
METRIC RATING
201st/ 347
METRIC RANK
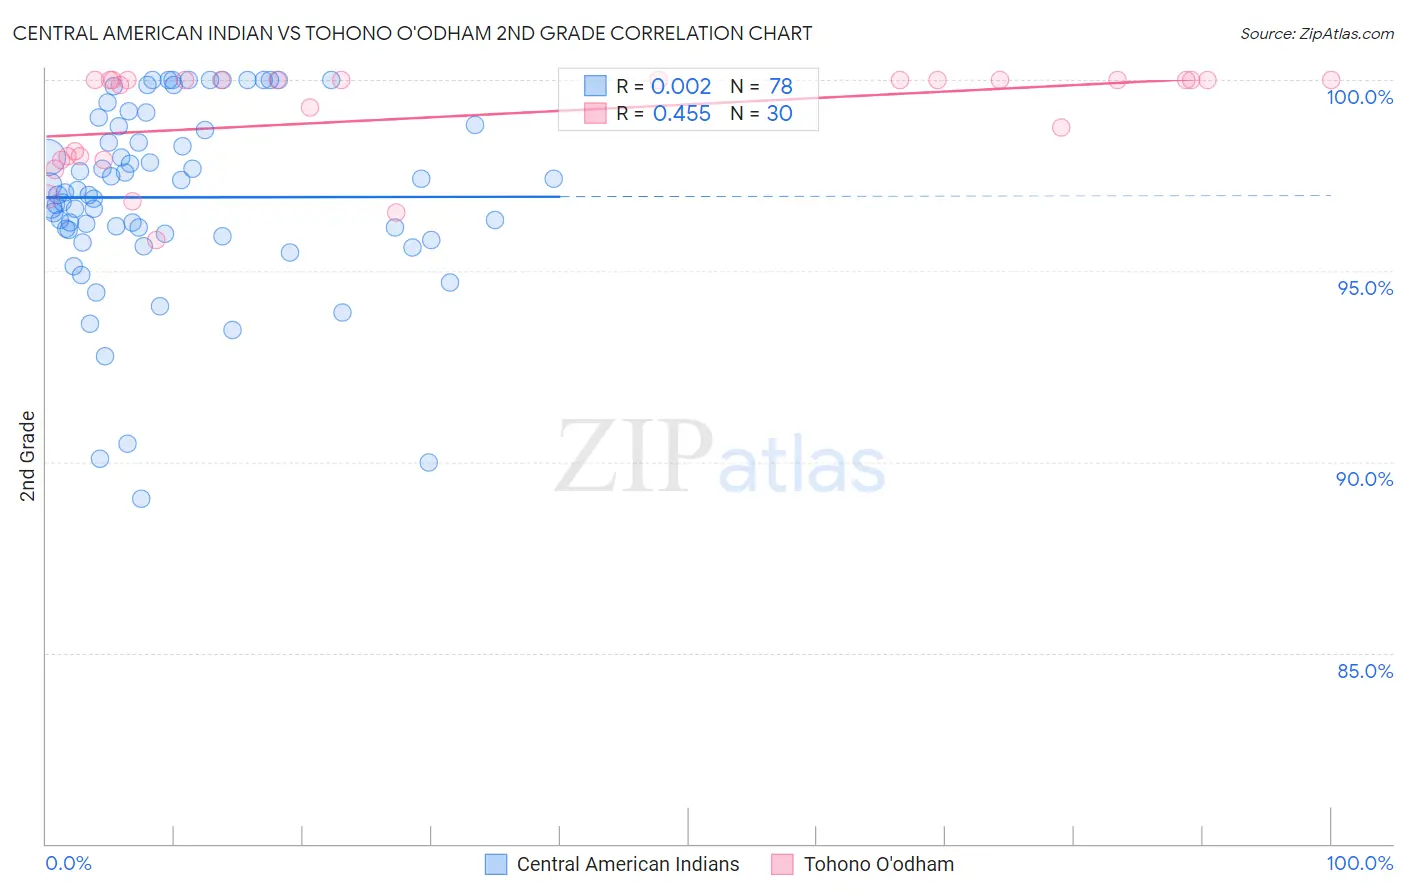
Central American Indian vs Tohono O'odham 2nd Grade Correlation Chart
The statistical analysis conducted on geographies consisting of 326,141,205 people shows no correlation between the proportion of Central American Indians and percentage of population with at least 2nd grade education in the United States with a correlation coefficient (R) of 0.002 and weighted average of 97.0%. Similarly, the statistical analysis conducted on geographies consisting of 58,723,100 people shows a moderate positive correlation between the proportion of Tohono O'odham and percentage of population with at least 2nd grade education in the United States with a correlation coefficient (R) of 0.455 and weighted average of 97.8%, a difference of 0.81%.
2nd Grade Correlation Summary
| Measurement | Central American Indian | Tohono O'odham |
| Minimum | 89.0% | 95.8% |
| Maximum | 100.0% | 100.0% |
| Range | 11.0% | 4.2% |
| Mean | 96.9% | 99.1% |
| Median | 97.0% | 100.0% |
| Interquartile 25% (IQ1) | 96.0% | 98.0% |
| Interquartile 75% (IQ3) | 98.8% | 100.0% |
| Interquartile Range (IQR) | 2.8% | 2.0% |
| Standard Deviation (Sample) | 2.5% | 1.3% |
| Standard Deviation (Population) | 2.4% | 1.3% |
Similar Demographics by 2nd Grade
Demographics Similar to Central American Indians by 2nd Grade
In terms of 2nd grade, the demographic groups most similar to Central American Indians are Immigrants from South Eastern Asia (97.0%, a difference of 0.020%), Somali (97.0%, a difference of 0.020%), Immigrants from Cuba (97.0%, a difference of 0.040%), Immigrants from Dominica (97.0%, a difference of 0.040%), and Haitian (97.0%, a difference of 0.040%).
| Demographics | Rating | Rank | 2nd Grade |
| Malaysians | 0.0 /100 | #294 | Tragic 97.1% |
| Immigrants | Grenada | 0.0 /100 | #295 | Tragic 97.1% |
| Immigrants | Immigrants | 0.0 /100 | #296 | Tragic 97.1% |
| Immigrants | Cuba | 0.0 /100 | #297 | Tragic 97.0% |
| Immigrants | Dominica | 0.0 /100 | #298 | Tragic 97.0% |
| Haitians | 0.0 /100 | #299 | Tragic 97.0% |
| Immigrants | South Eastern Asia | 0.0 /100 | #300 | Tragic 97.0% |
| Central American Indians | 0.0 /100 | #301 | Tragic 97.0% |
| Somalis | 0.0 /100 | #302 | Tragic 97.0% |
| Ecuadorians | 0.0 /100 | #303 | Tragic 96.9% |
| Immigrants | Caribbean | 0.0 /100 | #304 | Tragic 96.9% |
| Nicaraguans | 0.0 /100 | #305 | Tragic 96.9% |
| Immigrants | Somalia | 0.0 /100 | #306 | Tragic 96.9% |
| Immigrants | Azores | 0.0 /100 | #307 | Tragic 96.8% |
| Immigrants | Haiti | 0.0 /100 | #308 | Tragic 96.8% |
Demographics Similar to Tohono O'odham by 2nd Grade
In terms of 2nd grade, the demographic groups most similar to Tohono O'odham are Immigrants from Lebanon (97.8%, a difference of 0.0%), Immigrants from Ukraine (97.8%, a difference of 0.0%), Yuman (97.8%, a difference of 0.0%), Immigrants from Albania (97.8%, a difference of 0.010%), and Immigrants from Southern Europe (97.8%, a difference of 0.010%).
| Demographics | Rating | Rank | 2nd Grade |
| Paiute | 27.0 /100 | #194 | Fair 97.8% |
| Mongolians | 26.7 /100 | #195 | Fair 97.8% |
| Immigrants | Kenya | 26.4 /100 | #196 | Fair 97.8% |
| Immigrants | Uganda | 26.3 /100 | #197 | Fair 97.8% |
| Guamanians/Chamorros | 25.7 /100 | #198 | Fair 97.8% |
| Immigrants | Egypt | 24.4 /100 | #199 | Fair 97.8% |
| Immigrants | Lebanon | 20.9 /100 | #200 | Fair 97.8% |
| Tohono O'odham | 20.9 /100 | #201 | Fair 97.8% |
| Immigrants | Ukraine | 20.5 /100 | #202 | Fair 97.8% |
| Yuman | 20.0 /100 | #203 | Fair 97.8% |
| Immigrants | Albania | 18.4 /100 | #204 | Poor 97.8% |
| Immigrants | Southern Europe | 18.1 /100 | #205 | Poor 97.8% |
| Immigrants | Chile | 17.3 /100 | #206 | Poor 97.7% |
| Africans | 15.6 /100 | #207 | Poor 97.7% |
| Immigrants | Northern Africa | 12.3 /100 | #208 | Poor 97.7% |