Cajun vs Immigrants from Korea Family Households
COMPARE
Cajun
Immigrants from Korea
Family Households
Family Households Comparison
Cajuns
Immigrants from Korea
64.8%
FAMILY HOUSEHOLDS
89.4/ 100
METRIC RATING
132nd/ 347
METRIC RANK
66.0%
FAMILY HOUSEHOLDS
100.0/ 100
METRIC RATING
59th/ 347
METRIC RANK
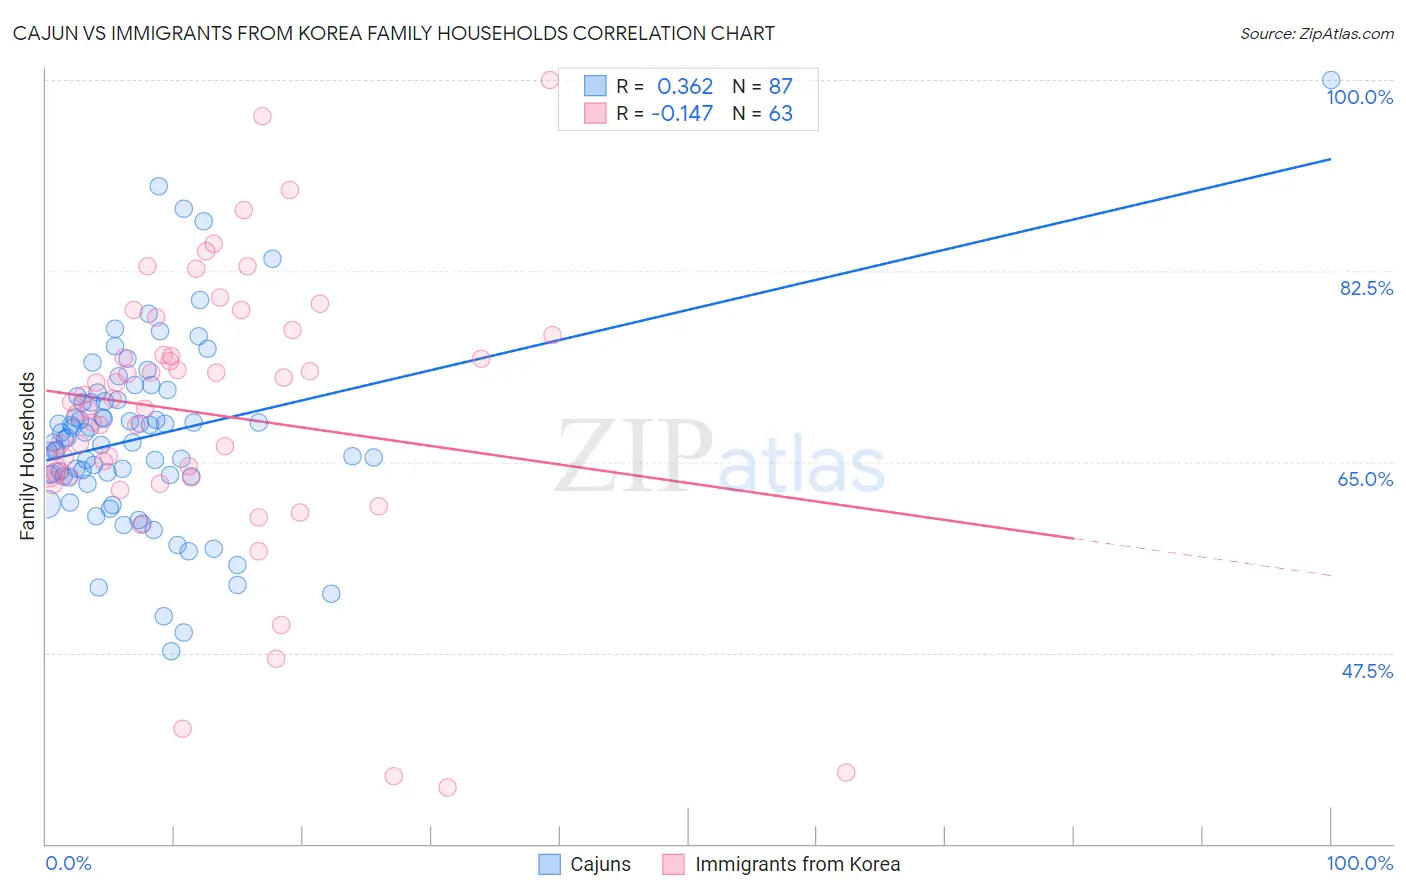
Cajun vs Immigrants from Korea Family Households Correlation Chart
The statistical analysis conducted on geographies consisting of 149,695,707 people shows a mild positive correlation between the proportion of Cajuns and percentage of family households in the United States with a correlation coefficient (R) of 0.362 and weighted average of 64.8%. Similarly, the statistical analysis conducted on geographies consisting of 415,966,940 people shows a poor negative correlation between the proportion of Immigrants from Korea and percentage of family households in the United States with a correlation coefficient (R) of -0.147 and weighted average of 66.0%, a difference of 2.0%.
Family Households Correlation Summary
| Measurement | Cajun | Immigrants from Korea |
| Minimum | 47.6% | 35.2% |
| Maximum | 100.0% | 100.0% |
| Range | 52.4% | 64.8% |
| Mean | 67.3% | 69.4% |
| Median | 67.2% | 70.4% |
| Interquartile 25% (IQ1) | 63.6% | 63.7% |
| Interquartile 75% (IQ3) | 70.7% | 76.6% |
| Interquartile Range (IQR) | 7.1% | 12.9% |
| Standard Deviation (Sample) | 8.6% | 12.8% |
| Standard Deviation (Population) | 8.6% | 12.7% |
Similar Demographics by Family Households
Demographics Similar to Cajuns by Family Households
In terms of family households, the demographic groups most similar to Cajuns are Belizean (64.8%, a difference of 0.0%), Nonimmigrants (64.8%, a difference of 0.020%), Immigrants from Italy (64.8%, a difference of 0.030%), Greek (64.7%, a difference of 0.040%), and Maltese (64.7%, a difference of 0.060%).
| Demographics | Rating | Rank | Family Households |
| Immigrants | Belize | 92.7 /100 | #125 | Exceptional 64.9% |
| Panamanians | 92.4 /100 | #126 | Exceptional 64.8% |
| Immigrants | Panama | 92.0 /100 | #127 | Exceptional 64.8% |
| Italians | 91.9 /100 | #128 | Exceptional 64.8% |
| Immigrants | Ecuador | 91.4 /100 | #129 | Exceptional 64.8% |
| Immigrants | Italy | 90.2 /100 | #130 | Exceptional 64.8% |
| Immigrants | Nonimmigrants | 90.1 /100 | #131 | Exceptional 64.8% |
| Cajuns | 89.4 /100 | #132 | Excellent 64.8% |
| Belizeans | 89.3 /100 | #133 | Excellent 64.8% |
| Greeks | 88.1 /100 | #134 | Excellent 64.7% |
| Maltese | 87.4 /100 | #135 | Excellent 64.7% |
| Immigrants | China | 86.6 /100 | #136 | Excellent 64.7% |
| Immigrants | Scotland | 86.4 /100 | #137 | Excellent 64.7% |
| Basques | 85.5 /100 | #138 | Excellent 64.7% |
| Immigrants | Jamaica | 85.3 /100 | #139 | Excellent 64.7% |
Demographics Similar to Immigrants from Korea by Family Households
In terms of family households, the demographic groups most similar to Immigrants from Korea are South American (66.0%, a difference of 0.010%), Immigrants from Asia (66.1%, a difference of 0.020%), Danish (66.0%, a difference of 0.030%), Central American (66.0%, a difference of 0.060%), and Immigrants from Indonesia (66.0%, a difference of 0.10%).
| Demographics | Rating | Rank | Family Households |
| Colombians | 100.0 /100 | #52 | Exceptional 66.3% |
| Afghans | 100.0 /100 | #53 | Exceptional 66.3% |
| Immigrants | Colombia | 100.0 /100 | #54 | Exceptional 66.3% |
| Immigrants | Immigrants | 100.0 /100 | #55 | Exceptional 66.1% |
| Immigrants | Hong Kong | 100.0 /100 | #56 | Exceptional 66.1% |
| Pennsylvania Germans | 100.0 /100 | #57 | Exceptional 66.1% |
| Immigrants | Asia | 100.0 /100 | #58 | Exceptional 66.1% |
| Immigrants | Korea | 100.0 /100 | #59 | Exceptional 66.0% |
| South Americans | 100.0 /100 | #60 | Exceptional 66.0% |
| Danes | 100.0 /100 | #61 | Exceptional 66.0% |
| Central Americans | 100.0 /100 | #62 | Exceptional 66.0% |
| Immigrants | Indonesia | 100.0 /100 | #63 | Exceptional 66.0% |
| Pima | 99.9 /100 | #64 | Exceptional 65.9% |
| Costa Ricans | 99.9 /100 | #65 | Exceptional 65.9% |
| Fijians | 99.9 /100 | #66 | Exceptional 65.9% |