Burmese vs Turkish Births to Unmarried Women
COMPARE
Burmese
Turkish
Births to Unmarried Women
Births to Unmarried Women Comparison
Burmese
Turks
26.4%
BIRTHS TO UNMARRIED WOMEN
99.9/ 100
METRIC RATING
22nd/ 347
METRIC RANK
27.4%
BIRTHS TO UNMARRIED WOMEN
99.6/ 100
METRIC RATING
40th/ 347
METRIC RANK
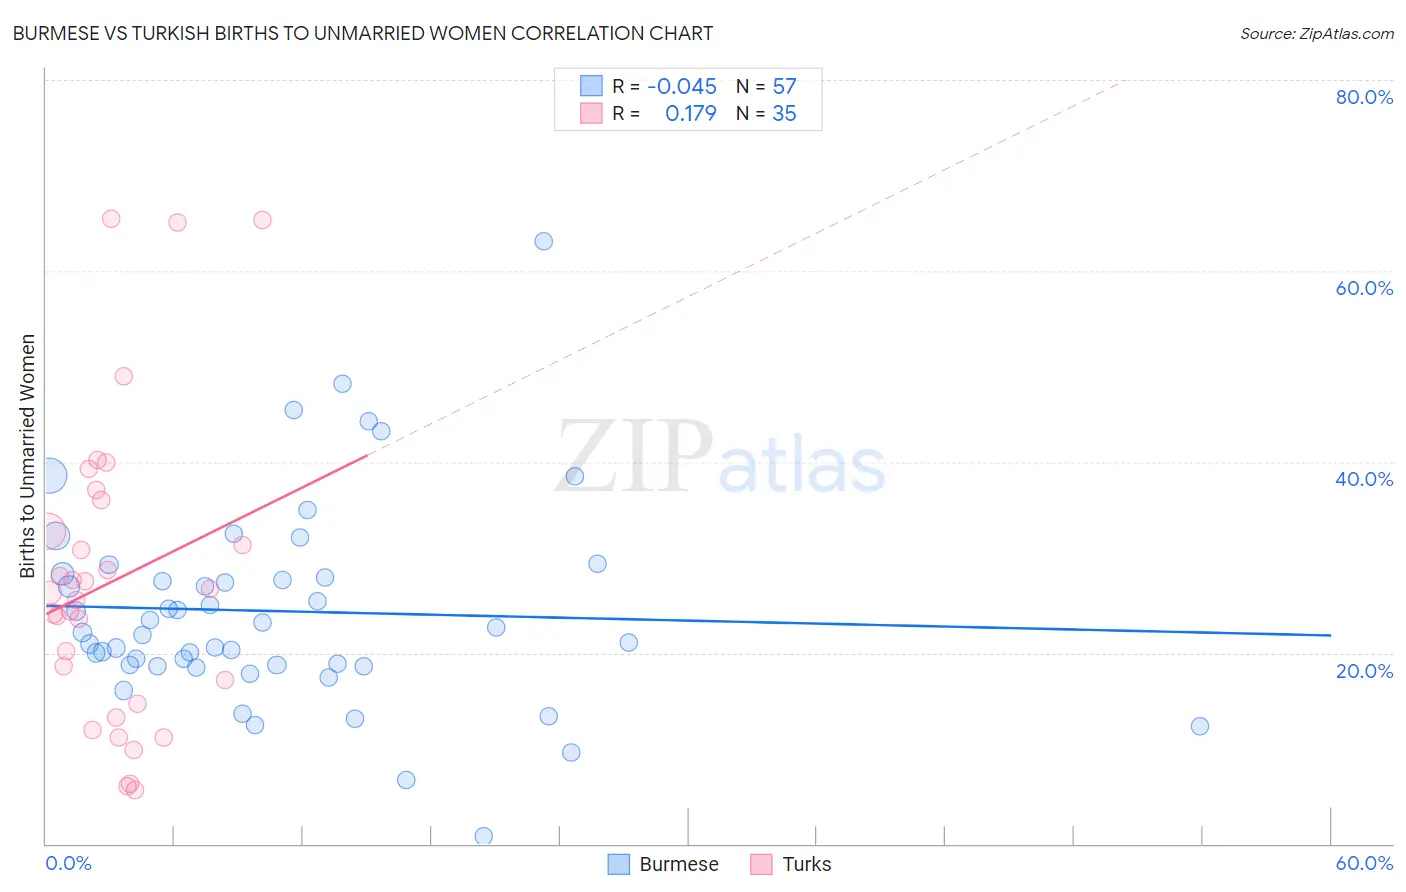
Burmese vs Turkish Births to Unmarried Women Correlation Chart
The statistical analysis conducted on geographies consisting of 428,519,429 people shows no correlation between the proportion of Burmese and percentage of births to unmarried women in the United States with a correlation coefficient (R) of -0.045 and weighted average of 26.4%. Similarly, the statistical analysis conducted on geographies consisting of 255,026,742 people shows a poor positive correlation between the proportion of Turks and percentage of births to unmarried women in the United States with a correlation coefficient (R) of 0.179 and weighted average of 27.4%, a difference of 4.1%.
Births to Unmarried Women Correlation Summary
| Measurement | Burmese | Turkish |
| Minimum | 0.80% | 5.6% |
| Maximum | 63.1% | 65.5% |
| Range | 62.3% | 59.9% |
| Mean | 24.4% | 27.5% |
| Median | 22.1% | 26.3% |
| Interquartile 25% (IQ1) | 18.7% | 14.6% |
| Interquartile 75% (IQ3) | 28.1% | 36.0% |
| Interquartile Range (IQR) | 9.4% | 21.4% |
| Standard Deviation (Sample) | 10.7% | 15.9% |
| Standard Deviation (Population) | 10.6% | 15.7% |
Demographics Similar to Burmese and Turks by Births to Unmarried Women
In terms of births to unmarried women, the demographic groups most similar to Burmese are Immigrants from Japan (26.4%, a difference of 0.19%), Soviet Union (26.3%, a difference of 0.22%), Immigrants from Australia (26.6%, a difference of 0.98%), Cambodian (26.7%, a difference of 1.2%), and Asian (26.8%, a difference of 1.6%). Similarly, the demographic groups most similar to Turks are Immigrants from Malaysia (27.4%, a difference of 0.32%), Iraqi (27.6%, a difference of 0.41%), Immigrants from Moldova (27.3%, a difference of 0.61%), Immigrants from Ukraine (27.2%, a difference of 0.75%), and Immigrants from Western Asia (27.2%, a difference of 0.84%).
| Demographics | Rating | Rank | Births to Unmarried Women |
| Soviet Union | 99.9 /100 | #21 | Exceptional 26.3% |
| Burmese | 99.9 /100 | #22 | Exceptional 26.4% |
| Immigrants | Japan | 99.9 /100 | #23 | Exceptional 26.4% |
| Immigrants | Australia | 99.9 /100 | #24 | Exceptional 26.6% |
| Cambodians | 99.9 /100 | #25 | Exceptional 26.7% |
| Asians | 99.9 /100 | #26 | Exceptional 26.8% |
| Immigrants | Asia | 99.9 /100 | #27 | Exceptional 26.8% |
| Okinawans | 99.8 /100 | #28 | Exceptional 26.9% |
| Cypriots | 99.8 /100 | #29 | Exceptional 27.0% |
| Bulgarians | 99.8 /100 | #30 | Exceptional 27.1% |
| Immigrants | Iraq | 99.8 /100 | #31 | Exceptional 27.1% |
| Immigrants | Russia | 99.8 /100 | #32 | Exceptional 27.1% |
| Immigrants | Sri Lanka | 99.8 /100 | #33 | Exceptional 27.2% |
| Immigrants | Pakistan | 99.8 /100 | #34 | Exceptional 27.2% |
| Immigrants | Ireland | 99.7 /100 | #35 | Exceptional 27.2% |
| Immigrants | Western Asia | 99.7 /100 | #36 | Exceptional 27.2% |
| Immigrants | Ukraine | 99.7 /100 | #37 | Exceptional 27.2% |
| Immigrants | Moldova | 99.7 /100 | #38 | Exceptional 27.3% |
| Immigrants | Malaysia | 99.7 /100 | #39 | Exceptional 27.4% |
| Turks | 99.6 /100 | #40 | Exceptional 27.4% |
| Iraqis | 99.6 /100 | #41 | Exceptional 27.6% |