Black/African American vs Cypriot Family Households
COMPARE
Black/African American
Cypriot
Family Households
Family Households Comparison
Blacks/African Americans
Cypriots
61.5%
FAMILY HOUSEHOLDS
0.0/ 100
METRIC RATING
327th/ 347
METRIC RANK
63.2%
FAMILY HOUSEHOLDS
0.6/ 100
METRIC RATING
260th/ 347
METRIC RANK
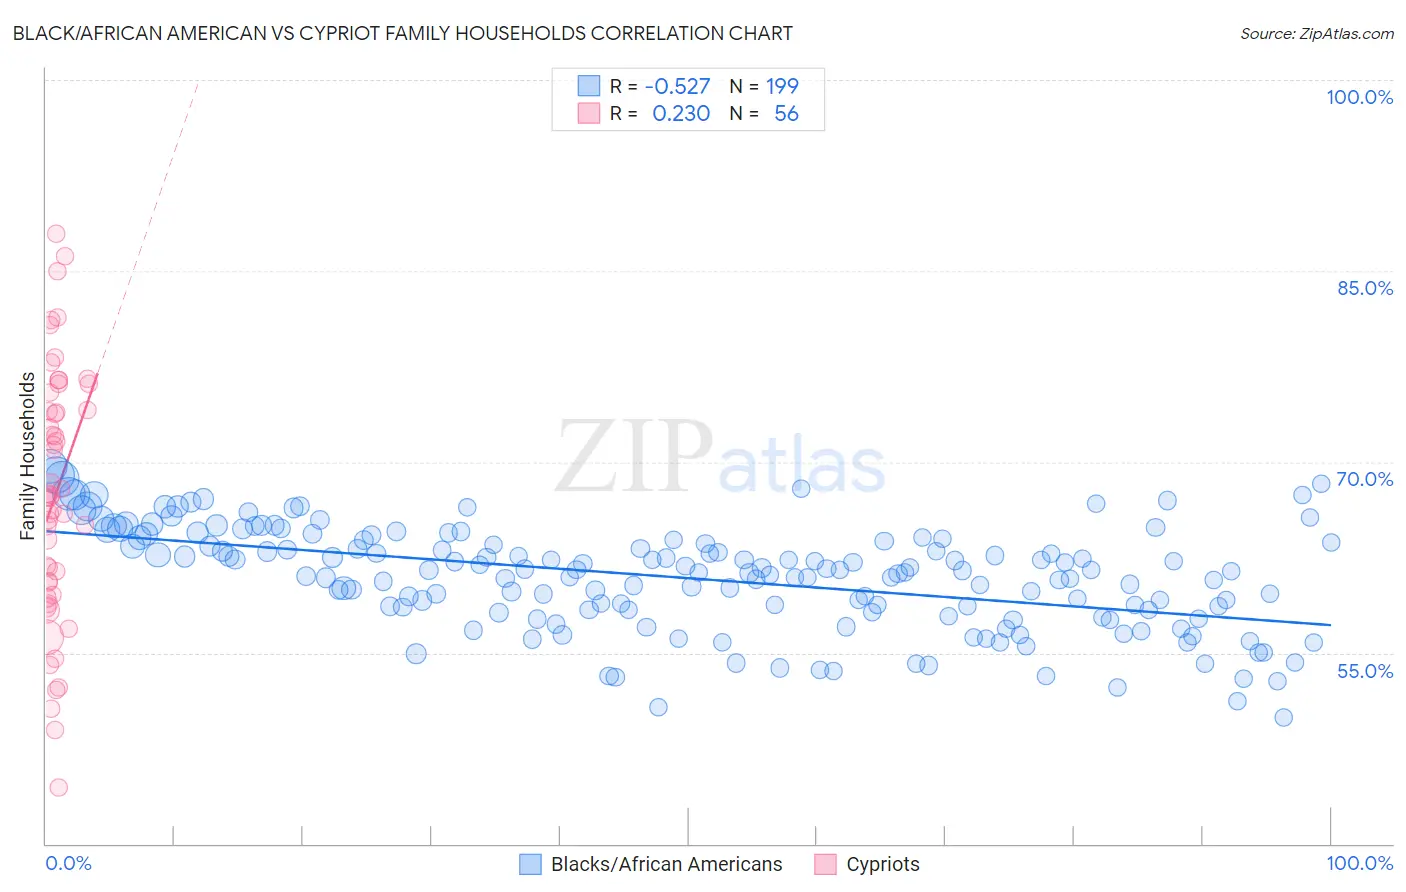
Black/African American vs Cypriot Family Households Correlation Chart
The statistical analysis conducted on geographies consisting of 565,332,954 people shows a substantial negative correlation between the proportion of Blacks/African Americans and percentage of family households in the United States with a correlation coefficient (R) of -0.527 and weighted average of 61.5%. Similarly, the statistical analysis conducted on geographies consisting of 61,857,015 people shows a weak positive correlation between the proportion of Cypriots and percentage of family households in the United States with a correlation coefficient (R) of 0.230 and weighted average of 63.2%, a difference of 2.8%.
Family Households Correlation Summary
| Measurement | Black/African American | Cypriot |
| Minimum | 49.9% | 44.4% |
| Maximum | 69.6% | 87.9% |
| Range | 19.8% | 43.5% |
| Mean | 60.9% | 67.4% |
| Median | 61.4% | 67.3% |
| Interquartile 25% (IQ1) | 58.4% | 60.0% |
| Interquartile 75% (IQ3) | 63.8% | 74.7% |
| Interquartile Range (IQR) | 5.4% | 14.7% |
| Standard Deviation (Sample) | 4.0% | 9.9% |
| Standard Deviation (Population) | 4.0% | 9.8% |
Similar Demographics by Family Households
Demographics Similar to Blacks/African Americans by Family Households
In terms of family households, the demographic groups most similar to Blacks/African Americans are Indonesian (61.5%, a difference of 0.020%), Kiowa (61.4%, a difference of 0.13%), Cambodian (61.4%, a difference of 0.15%), Immigrants from Switzerland (61.6%, a difference of 0.21%), and Immigrants from West Indies (61.6%, a difference of 0.22%).
| Demographics | Rating | Rank | Family Households |
| Ugandans | 0.0 /100 | #320 | Tragic 61.7% |
| Alsatians | 0.0 /100 | #321 | Tragic 61.7% |
| Immigrants | Serbia | 0.0 /100 | #322 | Tragic 61.6% |
| Tlingit-Haida | 0.0 /100 | #323 | Tragic 61.6% |
| Immigrants | West Indies | 0.0 /100 | #324 | Tragic 61.6% |
| Immigrants | Switzerland | 0.0 /100 | #325 | Tragic 61.6% |
| Indonesians | 0.0 /100 | #326 | Tragic 61.5% |
| Blacks/African Americans | 0.0 /100 | #327 | Tragic 61.5% |
| Kiowa | 0.0 /100 | #328 | Tragic 61.4% |
| Cambodians | 0.0 /100 | #329 | Tragic 61.4% |
| Immigrants | Australia | 0.0 /100 | #330 | Tragic 61.3% |
| Immigrants | France | 0.0 /100 | #331 | Tragic 61.3% |
| Ethiopians | 0.0 /100 | #332 | Tragic 61.2% |
| Immigrants | Ethiopia | 0.0 /100 | #333 | Tragic 61.2% |
| Immigrants | Eastern Africa | 0.0 /100 | #334 | Tragic 61.1% |
Demographics Similar to Cypriots by Family Households
In terms of family households, the demographic groups most similar to Cypriots are Immigrants from Western Europe (63.2%, a difference of 0.020%), Immigrants from Russia (63.2%, a difference of 0.020%), Immigrants from Barbados (63.2%, a difference of 0.030%), Immigrants from Ireland (63.2%, a difference of 0.030%), and Cheyenne (63.2%, a difference of 0.050%).
| Demographics | Rating | Rank | Family Households |
| Immigrants | Dominican Republic | 1.0 /100 | #253 | Tragic 63.3% |
| Slovaks | 1.0 /100 | #254 | Tragic 63.3% |
| Potawatomi | 1.0 /100 | #255 | Tragic 63.3% |
| Luxembourgers | 0.9 /100 | #256 | Tragic 63.3% |
| Icelanders | 0.8 /100 | #257 | Tragic 63.3% |
| Immigrants | Barbados | 0.7 /100 | #258 | Tragic 63.2% |
| Immigrants | Western Europe | 0.6 /100 | #259 | Tragic 63.2% |
| Cypriots | 0.6 /100 | #260 | Tragic 63.2% |
| Immigrants | Russia | 0.6 /100 | #261 | Tragic 63.2% |
| Immigrants | Ireland | 0.6 /100 | #262 | Tragic 63.2% |
| Cheyenne | 0.5 /100 | #263 | Tragic 63.2% |
| Kenyans | 0.5 /100 | #264 | Tragic 63.2% |
| Colville | 0.5 /100 | #265 | Tragic 63.2% |
| Immigrants | Western Africa | 0.5 /100 | #266 | Tragic 63.1% |
| Israelis | 0.4 /100 | #267 | Tragic 63.1% |