Blackfeet vs Zimbabwean Currently Married
COMPARE
Blackfeet
Zimbabwean
Currently Married
Currently Married Comparison
Blackfeet
Zimbabweans
44.2%
CURRENTLY MARRIED
0.3/ 100
METRIC RATING
251st/ 347
METRIC RANK
47.0%
CURRENTLY MARRIED
70.1/ 100
METRIC RATING
149th/ 347
METRIC RANK
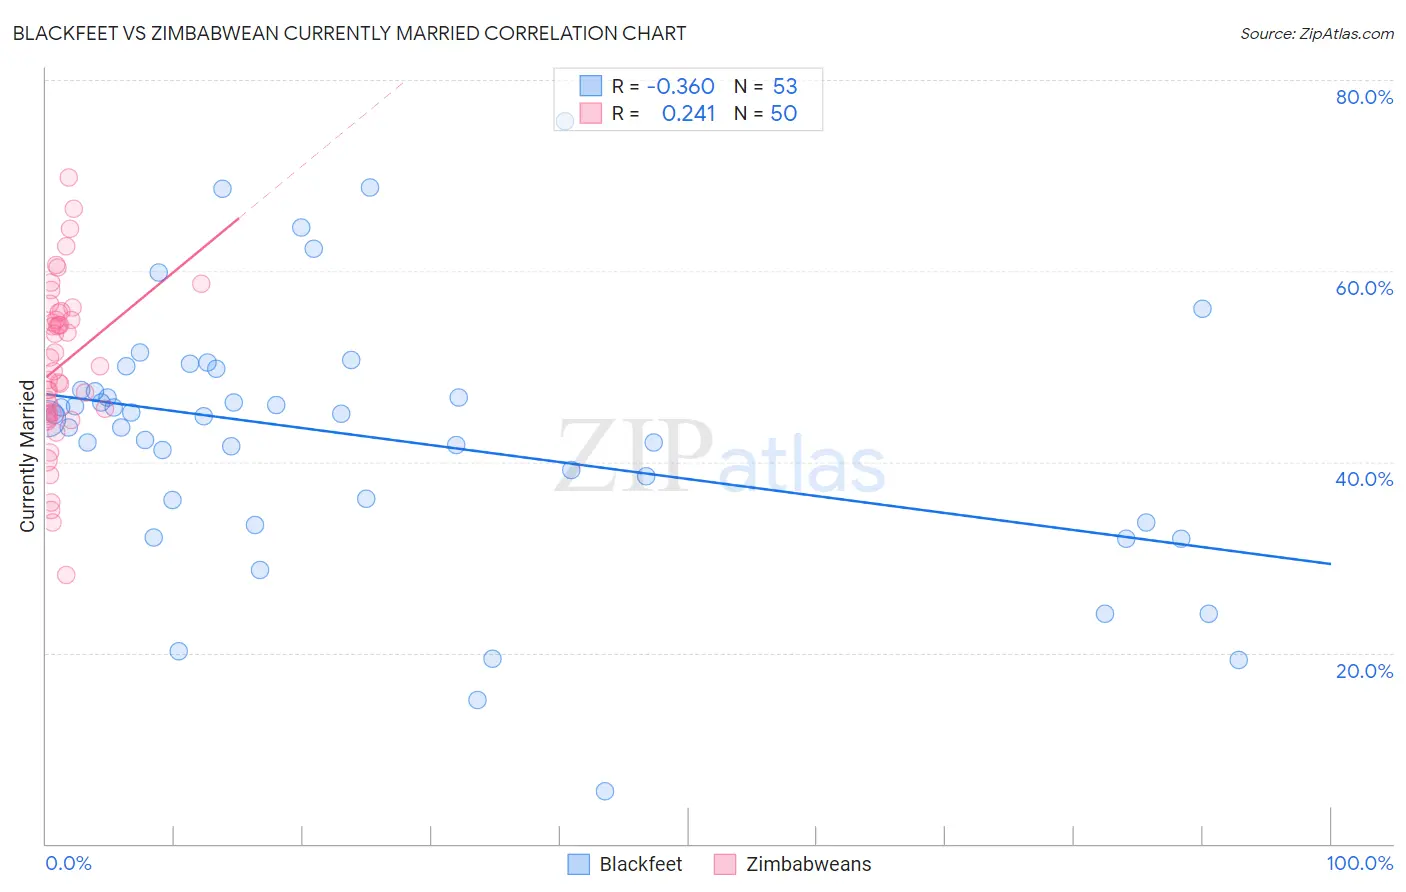
Blackfeet vs Zimbabwean Currently Married Correlation Chart
The statistical analysis conducted on geographies consisting of 309,564,713 people shows a mild negative correlation between the proportion of Blackfeet and percentage of population currently married in the United States with a correlation coefficient (R) of -0.360 and weighted average of 44.2%. Similarly, the statistical analysis conducted on geographies consisting of 69,204,681 people shows a weak positive correlation between the proportion of Zimbabweans and percentage of population currently married in the United States with a correlation coefficient (R) of 0.241 and weighted average of 47.0%, a difference of 6.4%.
Currently Married Correlation Summary
| Measurement | Blackfeet | Zimbabwean |
| Minimum | 5.5% | 28.2% |
| Maximum | 75.7% | 69.8% |
| Range | 70.2% | 41.6% |
| Mean | 42.5% | 50.2% |
| Median | 44.8% | 49.7% |
| Interquartile 25% (IQ1) | 34.9% | 45.1% |
| Interquartile 75% (IQ3) | 48.6% | 55.6% |
| Interquartile Range (IQR) | 13.7% | 10.5% |
| Standard Deviation (Sample) | 13.6% | 8.5% |
| Standard Deviation (Population) | 13.4% | 8.5% |
Similar Demographics by Currently Married
Demographics Similar to Blackfeet by Currently Married
In terms of currently married, the demographic groups most similar to Blackfeet are Hispanic or Latino (44.1%, a difference of 0.020%), Immigrants from Central America (44.1%, a difference of 0.050%), Immigrants from Eastern Africa (44.2%, a difference of 0.060%), Immigrants from Cameroon (44.2%, a difference of 0.080%), and Nicaraguan (44.2%, a difference of 0.10%).
| Demographics | Rating | Rank | Currently Married |
| Japanese | 0.6 /100 | #244 | Tragic 44.5% |
| Immigrants | Armenia | 0.4 /100 | #245 | Tragic 44.3% |
| Immigrants | Burma/Myanmar | 0.4 /100 | #246 | Tragic 44.3% |
| Ugandans | 0.4 /100 | #247 | Tragic 44.2% |
| Nicaraguans | 0.3 /100 | #248 | Tragic 44.2% |
| Immigrants | Cameroon | 0.3 /100 | #249 | Tragic 44.2% |
| Immigrants | Eastern Africa | 0.3 /100 | #250 | Tragic 44.2% |
| Blackfeet | 0.3 /100 | #251 | Tragic 44.2% |
| Hispanics or Latinos | 0.3 /100 | #252 | Tragic 44.1% |
| Immigrants | Central America | 0.3 /100 | #253 | Tragic 44.1% |
| Vietnamese | 0.2 /100 | #254 | Tragic 44.0% |
| Yakama | 0.2 /100 | #255 | Tragic 44.0% |
| Shoshone | 0.2 /100 | #256 | Tragic 44.0% |
| Immigrants | Africa | 0.2 /100 | #257 | Tragic 43.9% |
| Ute | 0.2 /100 | #258 | Tragic 43.9% |
Demographics Similar to Zimbabweans by Currently Married
In terms of currently married, the demographic groups most similar to Zimbabweans are Immigrants from Turkey (47.0%, a difference of 0.0%), Cambodian (47.0%, a difference of 0.010%), Chilean (47.0%, a difference of 0.010%), Immigrants from Serbia (47.0%, a difference of 0.060%), and Immigrants from Venezuela (47.0%, a difference of 0.060%).
| Demographics | Rating | Rank | Currently Married |
| Argentineans | 74.4 /100 | #142 | Good 47.1% |
| Guamanians/Chamorros | 74.2 /100 | #143 | Good 47.1% |
| Hmong | 73.4 /100 | #144 | Good 47.1% |
| Immigrants | South Eastern Asia | 72.9 /100 | #145 | Good 47.1% |
| Carpatho Rusyns | 72.6 /100 | #146 | Good 47.0% |
| Immigrants | Argentina | 72.0 /100 | #147 | Good 47.0% |
| Cambodians | 70.4 /100 | #148 | Good 47.0% |
| Zimbabweans | 70.1 /100 | #149 | Good 47.0% |
| Immigrants | Turkey | 70.0 /100 | #150 | Good 47.0% |
| Chileans | 69.8 /100 | #151 | Good 47.0% |
| Immigrants | Serbia | 68.8 /100 | #152 | Good 47.0% |
| Immigrants | Venezuela | 68.6 /100 | #153 | Good 47.0% |
| Albanians | 68.6 /100 | #154 | Good 47.0% |
| Arabs | 68.6 /100 | #155 | Good 47.0% |
| Spanish | 68.1 /100 | #156 | Good 47.0% |