Belizean vs Yugoslavian Single Mother Households
COMPARE
Belizean
Yugoslavian
Single Mother Households
Single Mother Households Comparison
Belizeans
Yugoslavians
7.6%
SINGLE MOTHER HOUSEHOLDS
0.1/ 100
METRIC RATING
273rd/ 347
METRIC RANK
6.1%
SINGLE MOTHER HOUSEHOLDS
73.1/ 100
METRIC RATING
159th/ 347
METRIC RANK
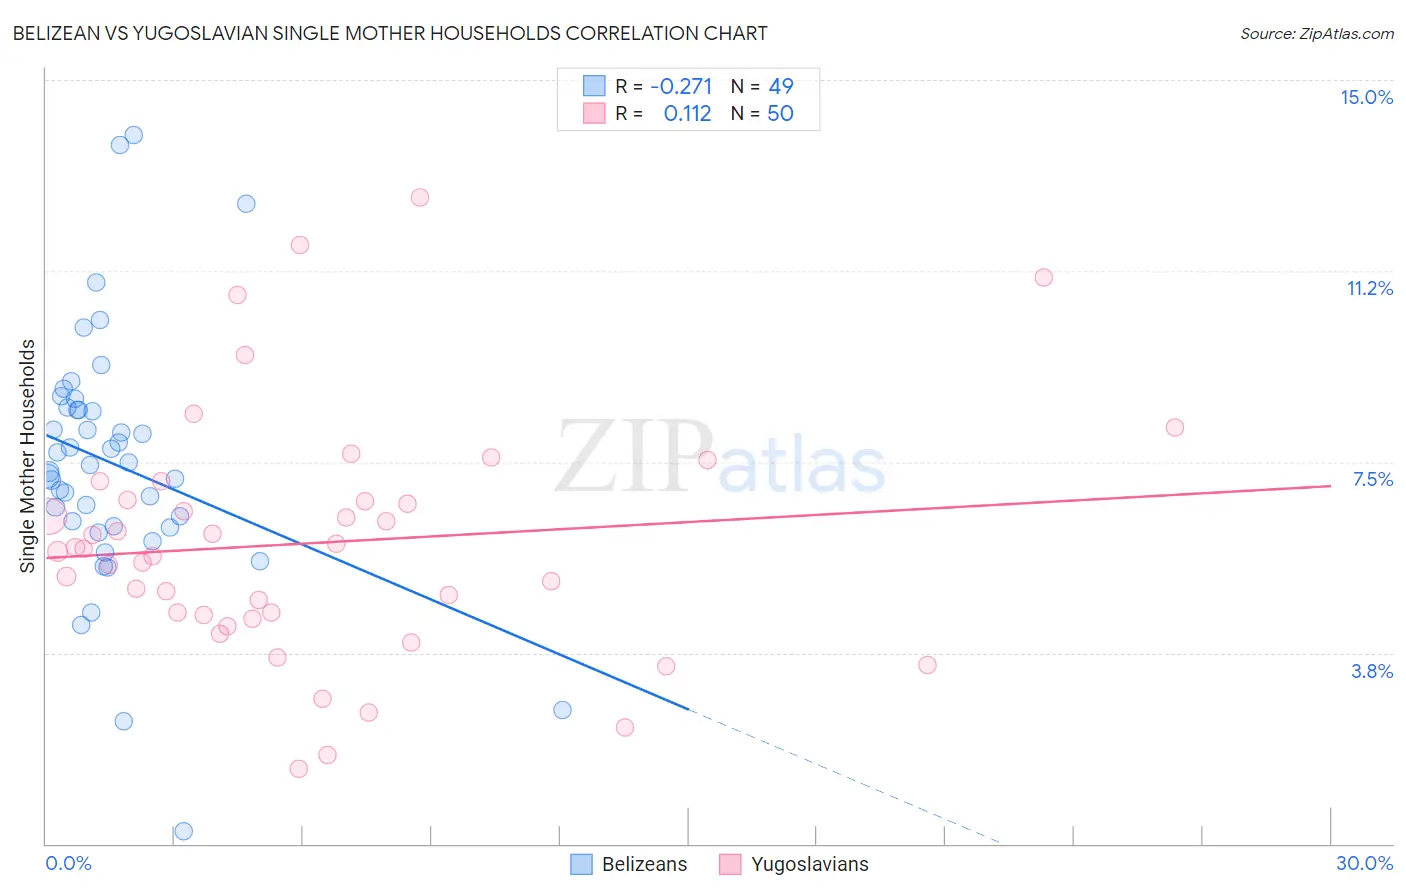
Belizean vs Yugoslavian Single Mother Households Correlation Chart
The statistical analysis conducted on geographies consisting of 144,083,349 people shows a weak negative correlation between the proportion of Belizeans and percentage of single mother households in the United States with a correlation coefficient (R) of -0.271 and weighted average of 7.6%. Similarly, the statistical analysis conducted on geographies consisting of 285,023,099 people shows a poor positive correlation between the proportion of Yugoslavians and percentage of single mother households in the United States with a correlation coefficient (R) of 0.112 and weighted average of 6.1%, a difference of 23.1%.
Single Mother Households Correlation Summary
| Measurement | Belizean | Yugoslavian |
| Minimum | 0.26% | 1.5% |
| Maximum | 13.9% | 12.7% |
| Range | 13.7% | 11.2% |
| Mean | 7.5% | 5.9% |
| Median | 7.4% | 5.8% |
| Interquartile 25% (IQ1) | 6.2% | 4.5% |
| Interquartile 75% (IQ3) | 8.5% | 6.7% |
| Interquartile Range (IQR) | 2.3% | 2.3% |
| Standard Deviation (Sample) | 2.5% | 2.4% |
| Standard Deviation (Population) | 2.5% | 2.4% |
Similar Demographics by Single Mother Households
Demographics Similar to Belizeans by Single Mother Households
In terms of single mother households, the demographic groups most similar to Belizeans are Immigrants from Guyana (7.6%, a difference of 0.040%), Central American Indian (7.6%, a difference of 0.14%), Immigrants from the Azores (7.5%, a difference of 0.31%), Salvadoran (7.5%, a difference of 0.32%), and Immigrants from Cuba (7.5%, a difference of 0.40%).
| Demographics | Rating | Rank | Single Mother Households |
| Nepalese | 0.1 /100 | #266 | Tragic 7.5% |
| Blackfeet | 0.1 /100 | #267 | Tragic 7.5% |
| Indonesians | 0.1 /100 | #268 | Tragic 7.5% |
| Somalis | 0.1 /100 | #269 | Tragic 7.5% |
| Immigrants | Cuba | 0.1 /100 | #270 | Tragic 7.5% |
| Salvadorans | 0.1 /100 | #271 | Tragic 7.5% |
| Immigrants | Azores | 0.1 /100 | #272 | Tragic 7.5% |
| Belizeans | 0.1 /100 | #273 | Tragic 7.6% |
| Immigrants | Guyana | 0.1 /100 | #274 | Tragic 7.6% |
| Central American Indians | 0.1 /100 | #275 | Tragic 7.6% |
| Guyanese | 0.1 /100 | #276 | Tragic 7.6% |
| Immigrants | Trinidad and Tobago | 0.1 /100 | #277 | Tragic 7.6% |
| Central Americans | 0.1 /100 | #278 | Tragic 7.6% |
| Immigrants | El Salvador | 0.0 /100 | #279 | Tragic 7.6% |
| Immigrants | Sierra Leone | 0.0 /100 | #280 | Tragic 7.7% |
Demographics Similar to Yugoslavians by Single Mother Households
In terms of single mother households, the demographic groups most similar to Yugoslavians are Iraqi (6.1%, a difference of 0.010%), Celtic (6.1%, a difference of 0.040%), Immigrants from Germany (6.1%, a difference of 0.090%), Chilean (6.1%, a difference of 0.17%), and Native Hawaiian (6.1%, a difference of 0.28%).
| Demographics | Rating | Rank | Single Mother Households |
| Pakistanis | 79.2 /100 | #152 | Good 6.1% |
| Immigrants | Brazil | 78.9 /100 | #153 | Good 6.1% |
| Immigrants | Philippines | 78.5 /100 | #154 | Good 6.1% |
| Whites/Caucasians | 76.5 /100 | #155 | Good 6.1% |
| Native Hawaiians | 75.0 /100 | #156 | Good 6.1% |
| Chileans | 74.2 /100 | #157 | Good 6.1% |
| Celtics | 73.3 /100 | #158 | Good 6.1% |
| Yugoslavians | 73.1 /100 | #159 | Good 6.1% |
| Iraqis | 73.0 /100 | #160 | Good 6.1% |
| Immigrants | Germany | 72.4 /100 | #161 | Good 6.1% |
| Immigrants | Zimbabwe | 69.9 /100 | #162 | Good 6.2% |
| Alsatians | 68.7 /100 | #163 | Good 6.2% |
| Immigrants | Northern Africa | 68.0 /100 | #164 | Good 6.2% |
| Immigrants | Syria | 67.4 /100 | #165 | Good 6.2% |
| Sri Lankans | 63.9 /100 | #166 | Good 6.2% |