Belizean vs Immigrants from Zimbabwe Single Mother Households
COMPARE
Belizean
Immigrants from Zimbabwe
Single Mother Households
Single Mother Households Comparison
Belizeans
Immigrants from Zimbabwe
7.6%
SINGLE MOTHER HOUSEHOLDS
0.1/ 100
METRIC RATING
273rd/ 347
METRIC RANK
6.2%
SINGLE MOTHER HOUSEHOLDS
69.9/ 100
METRIC RATING
162nd/ 347
METRIC RANK
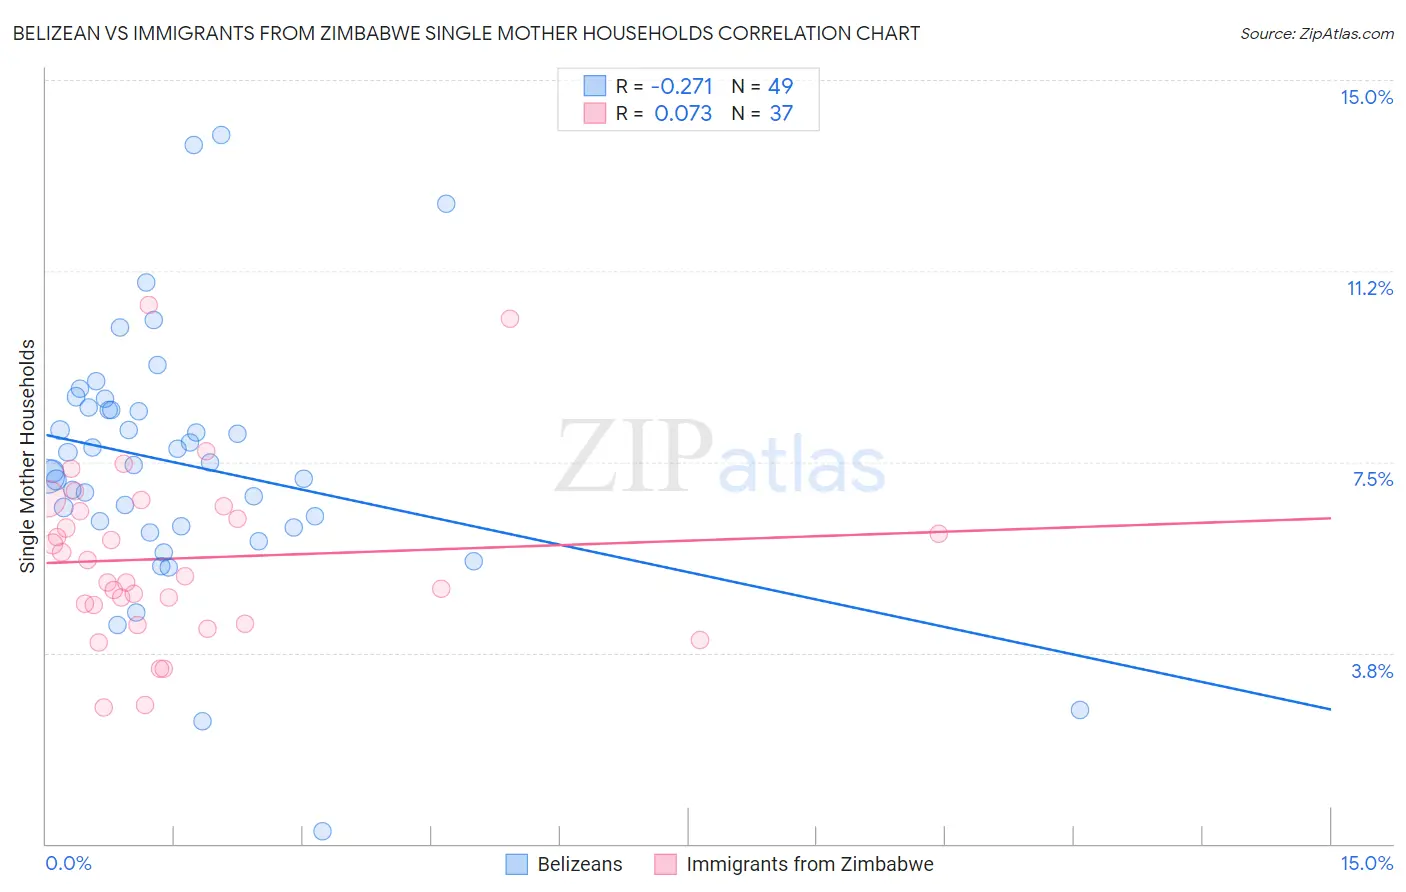
Belizean vs Immigrants from Zimbabwe Single Mother Households Correlation Chart
The statistical analysis conducted on geographies consisting of 144,083,349 people shows a weak negative correlation between the proportion of Belizeans and percentage of single mother households in the United States with a correlation coefficient (R) of -0.271 and weighted average of 7.6%. Similarly, the statistical analysis conducted on geographies consisting of 117,740,181 people shows a slight positive correlation between the proportion of Immigrants from Zimbabwe and percentage of single mother households in the United States with a correlation coefficient (R) of 0.073 and weighted average of 6.2%, a difference of 22.6%.
Single Mother Households Correlation Summary
| Measurement | Belizean | Immigrants from Zimbabwe |
| Minimum | 0.26% | 2.7% |
| Maximum | 13.9% | 10.6% |
| Range | 13.7% | 7.9% |
| Mean | 7.5% | 5.6% |
| Median | 7.4% | 5.2% |
| Interquartile 25% (IQ1) | 6.2% | 4.5% |
| Interquartile 75% (IQ3) | 8.5% | 6.6% |
| Interquartile Range (IQR) | 2.3% | 2.1% |
| Standard Deviation (Sample) | 2.5% | 1.7% |
| Standard Deviation (Population) | 2.5% | 1.7% |
Similar Demographics by Single Mother Households
Demographics Similar to Belizeans by Single Mother Households
In terms of single mother households, the demographic groups most similar to Belizeans are Immigrants from Guyana (7.6%, a difference of 0.040%), Central American Indian (7.6%, a difference of 0.14%), Immigrants from the Azores (7.5%, a difference of 0.31%), Salvadoran (7.5%, a difference of 0.32%), and Immigrants from Cuba (7.5%, a difference of 0.40%).
| Demographics | Rating | Rank | Single Mother Households |
| Nepalese | 0.1 /100 | #266 | Tragic 7.5% |
| Blackfeet | 0.1 /100 | #267 | Tragic 7.5% |
| Indonesians | 0.1 /100 | #268 | Tragic 7.5% |
| Somalis | 0.1 /100 | #269 | Tragic 7.5% |
| Immigrants | Cuba | 0.1 /100 | #270 | Tragic 7.5% |
| Salvadorans | 0.1 /100 | #271 | Tragic 7.5% |
| Immigrants | Azores | 0.1 /100 | #272 | Tragic 7.5% |
| Belizeans | 0.1 /100 | #273 | Tragic 7.6% |
| Immigrants | Guyana | 0.1 /100 | #274 | Tragic 7.6% |
| Central American Indians | 0.1 /100 | #275 | Tragic 7.6% |
| Guyanese | 0.1 /100 | #276 | Tragic 7.6% |
| Immigrants | Trinidad and Tobago | 0.1 /100 | #277 | Tragic 7.6% |
| Central Americans | 0.1 /100 | #278 | Tragic 7.6% |
| Immigrants | El Salvador | 0.0 /100 | #279 | Tragic 7.6% |
| Immigrants | Sierra Leone | 0.0 /100 | #280 | Tragic 7.7% |
Demographics Similar to Immigrants from Zimbabwe by Single Mother Households
In terms of single mother households, the demographic groups most similar to Immigrants from Zimbabwe are Alsatian (6.2%, a difference of 0.16%), Immigrants from Northern Africa (6.2%, a difference of 0.25%), Immigrants from Syria (6.2%, a difference of 0.32%), Immigrants from Germany (6.1%, a difference of 0.34%), and Iraqi (6.1%, a difference of 0.42%).
| Demographics | Rating | Rank | Single Mother Households |
| Whites/Caucasians | 76.5 /100 | #155 | Good 6.1% |
| Native Hawaiians | 75.0 /100 | #156 | Good 6.1% |
| Chileans | 74.2 /100 | #157 | Good 6.1% |
| Celtics | 73.3 /100 | #158 | Good 6.1% |
| Yugoslavians | 73.1 /100 | #159 | Good 6.1% |
| Iraqis | 73.0 /100 | #160 | Good 6.1% |
| Immigrants | Germany | 72.4 /100 | #161 | Good 6.1% |
| Immigrants | Zimbabwe | 69.9 /100 | #162 | Good 6.2% |
| Alsatians | 68.7 /100 | #163 | Good 6.2% |
| Immigrants | Northern Africa | 68.0 /100 | #164 | Good 6.2% |
| Immigrants | Syria | 67.4 /100 | #165 | Good 6.2% |
| Sri Lankans | 63.9 /100 | #166 | Good 6.2% |
| Brazilians | 59.1 /100 | #167 | Average 6.2% |
| Immigrants | Chile | 58.3 /100 | #168 | Average 6.3% |
| Puget Sound Salish | 58.1 /100 | #169 | Average 6.3% |