Bahamian vs Immigrants from Spain Family Households with Children
COMPARE
Bahamian
Immigrants from Spain
Family Households with Children
Family Households with Children Comparison
Bahamians
Immigrants from Spain
26.5%
FAMILY HOUSEHOLDS WITH CHILDREN
0.2/ 100
METRIC RATING
291st/ 347
METRIC RANK
26.6%
FAMILY HOUSEHOLDS WITH CHILDREN
0.5/ 100
METRIC RATING
276th/ 347
METRIC RANK
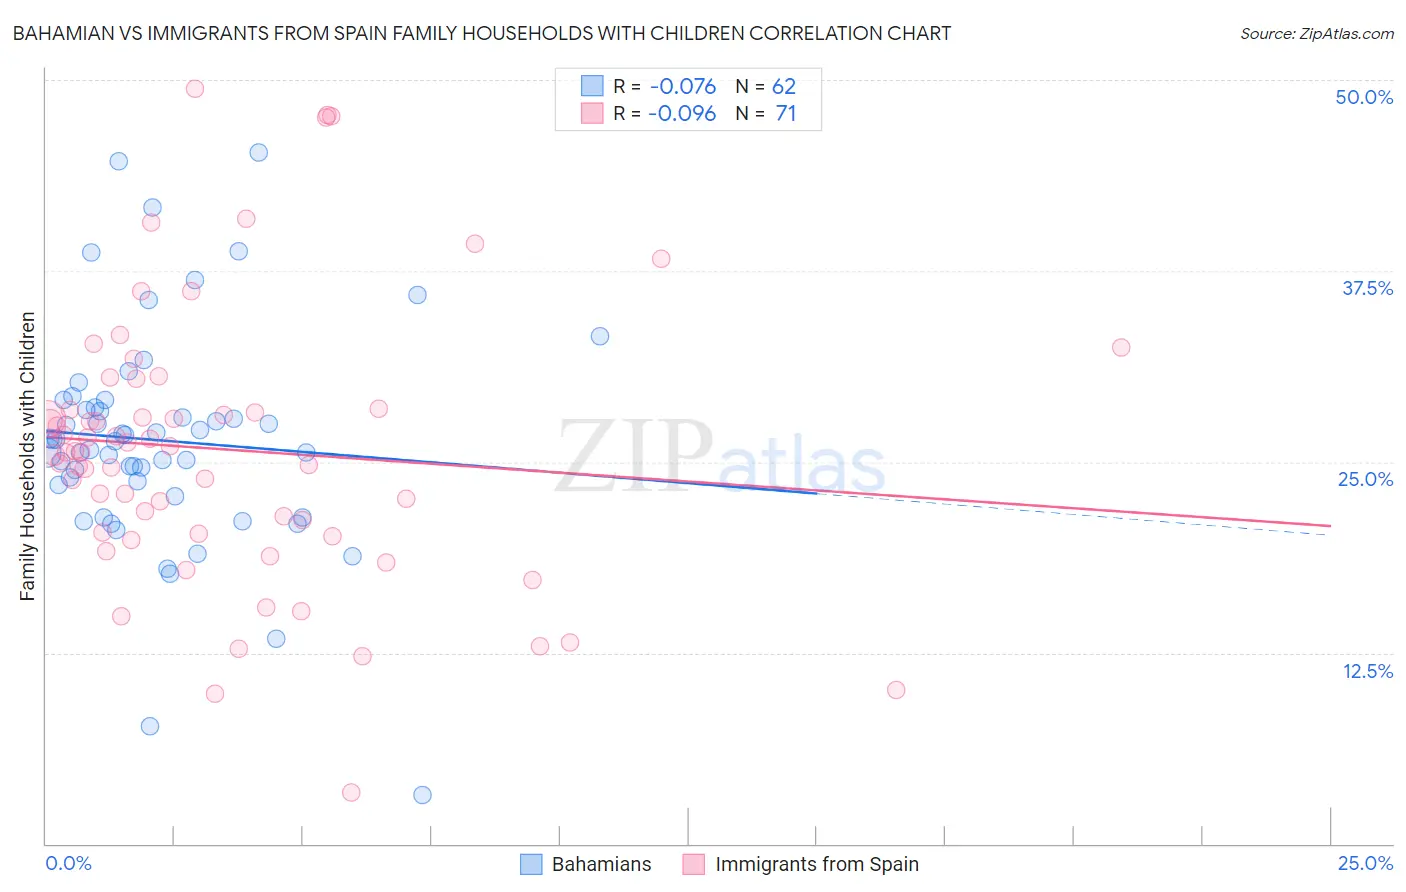
Bahamian vs Immigrants from Spain Family Households with Children Correlation Chart
The statistical analysis conducted on geographies consisting of 112,612,405 people shows a slight negative correlation between the proportion of Bahamians and percentage of family households with children in the United States with a correlation coefficient (R) of -0.076 and weighted average of 26.5%. Similarly, the statistical analysis conducted on geographies consisting of 239,534,267 people shows a slight negative correlation between the proportion of Immigrants from Spain and percentage of family households with children in the United States with a correlation coefficient (R) of -0.096 and weighted average of 26.6%, a difference of 0.65%.
Family Households with Children Correlation Summary
| Measurement | Bahamian | Immigrants from Spain |
| Minimum | 3.2% | 3.4% |
| Maximum | 45.3% | 49.4% |
| Range | 42.1% | 46.0% |
| Mean | 26.4% | 25.8% |
| Median | 26.4% | 25.7% |
| Interquartile 25% (IQ1) | 23.5% | 20.3% |
| Interquartile 75% (IQ3) | 28.6% | 28.5% |
| Interquartile Range (IQR) | 5.1% | 8.2% |
| Standard Deviation (Sample) | 7.3% | 9.1% |
| Standard Deviation (Population) | 7.2% | 9.1% |
Demographics Similar to Bahamians and Immigrants from Spain by Family Households with Children
In terms of family households with children, the demographic groups most similar to Bahamians are Albanian (26.5%, a difference of 0.010%), Polish (26.5%, a difference of 0.010%), Black/African American (26.5%, a difference of 0.060%), Immigrants from Sweden (26.5%, a difference of 0.12%), and Russian (26.5%, a difference of 0.16%). Similarly, the demographic groups most similar to Immigrants from Spain are Immigrants from Northern Europe (26.7%, a difference of 0.030%), Celtic (26.6%, a difference of 0.080%), Eastern European (26.7%, a difference of 0.11%), Immigrants from Hungary (26.7%, a difference of 0.12%), and Immigrants from Europe (26.6%, a difference of 0.14%).
| Demographics | Rating | Rank | Family Households with Children |
| Immigrants | Hungary | 0.6 /100 | #273 | Tragic 26.7% |
| Eastern Europeans | 0.6 /100 | #274 | Tragic 26.7% |
| Immigrants | Northern Europe | 0.5 /100 | #275 | Tragic 26.7% |
| Immigrants | Spain | 0.5 /100 | #276 | Tragic 26.6% |
| Celtics | 0.4 /100 | #277 | Tragic 26.6% |
| Immigrants | Europe | 0.4 /100 | #278 | Tragic 26.6% |
| Finns | 0.4 /100 | #279 | Tragic 26.6% |
| Senegalese | 0.4 /100 | #280 | Tragic 26.6% |
| Lithuanians | 0.3 /100 | #281 | Tragic 26.6% |
| French American Indians | 0.3 /100 | #282 | Tragic 26.6% |
| Immigrants | North America | 0.3 /100 | #283 | Tragic 26.6% |
| Immigrants | Canada | 0.3 /100 | #284 | Tragic 26.5% |
| Cambodians | 0.2 /100 | #285 | Tragic 26.5% |
| Immigrants | Senegal | 0.2 /100 | #286 | Tragic 26.5% |
| Shoshone | 0.2 /100 | #287 | Tragic 26.5% |
| Russians | 0.2 /100 | #288 | Tragic 26.5% |
| Immigrants | Sweden | 0.2 /100 | #289 | Tragic 26.5% |
| Albanians | 0.2 /100 | #290 | Tragic 26.5% |
| Bahamians | 0.2 /100 | #291 | Tragic 26.5% |
| Poles | 0.2 /100 | #292 | Tragic 26.5% |
| Blacks/African Americans | 0.1 /100 | #293 | Tragic 26.5% |