Bahamian vs Immigrants from Northern Europe Family Households with Children
COMPARE
Bahamian
Immigrants from Northern Europe
Family Households with Children
Family Households with Children Comparison
Bahamians
Immigrants from Northern Europe
26.5%
FAMILY HOUSEHOLDS WITH CHILDREN
0.2/ 100
METRIC RATING
291st/ 347
METRIC RANK
26.7%
FAMILY HOUSEHOLDS WITH CHILDREN
0.5/ 100
METRIC RATING
275th/ 347
METRIC RANK
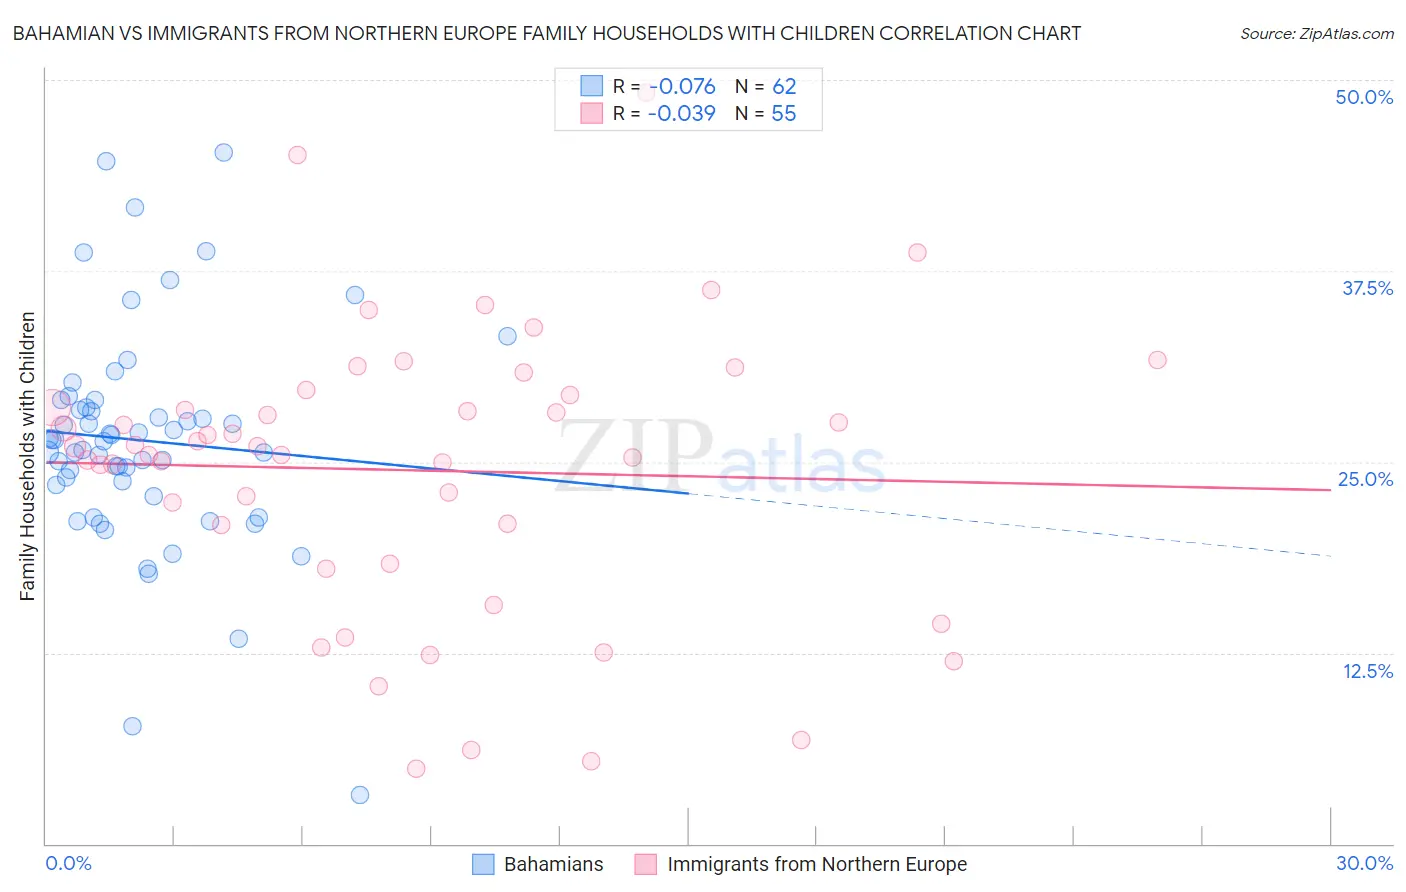
Bahamian vs Immigrants from Northern Europe Family Households with Children Correlation Chart
The statistical analysis conducted on geographies consisting of 112,612,405 people shows a slight negative correlation between the proportion of Bahamians and percentage of family households with children in the United States with a correlation coefficient (R) of -0.076 and weighted average of 26.5%. Similarly, the statistical analysis conducted on geographies consisting of 476,707,678 people shows no correlation between the proportion of Immigrants from Northern Europe and percentage of family households with children in the United States with a correlation coefficient (R) of -0.039 and weighted average of 26.7%, a difference of 0.67%.
Family Households with Children Correlation Summary
| Measurement | Bahamian | Immigrants from Northern Europe |
| Minimum | 3.2% | 4.9% |
| Maximum | 45.3% | 49.2% |
| Range | 42.1% | 44.3% |
| Mean | 26.4% | 24.4% |
| Median | 26.4% | 26.0% |
| Interquartile 25% (IQ1) | 23.5% | 18.4% |
| Interquartile 75% (IQ3) | 28.6% | 29.4% |
| Interquartile Range (IQR) | 5.1% | 11.1% |
| Standard Deviation (Sample) | 7.3% | 9.3% |
| Standard Deviation (Population) | 7.2% | 9.2% |
Demographics Similar to Bahamians and Immigrants from Northern Europe by Family Households with Children
In terms of family households with children, the demographic groups most similar to Bahamians are Albanian (26.5%, a difference of 0.010%), Polish (26.5%, a difference of 0.010%), Black/African American (26.5%, a difference of 0.060%), Immigrants from Sweden (26.5%, a difference of 0.12%), and Russian (26.5%, a difference of 0.16%). Similarly, the demographic groups most similar to Immigrants from Northern Europe are Immigrants from Spain (26.6%, a difference of 0.030%), Immigrants from Hungary (26.7%, a difference of 0.090%), Eastern European (26.7%, a difference of 0.090%), Celtic (26.6%, a difference of 0.11%), and Immigrants from Europe (26.6%, a difference of 0.17%).
| Demographics | Rating | Rank | Family Households with Children |
| Immigrants | Hungary | 0.6 /100 | #273 | Tragic 26.7% |
| Eastern Europeans | 0.6 /100 | #274 | Tragic 26.7% |
| Immigrants | Northern Europe | 0.5 /100 | #275 | Tragic 26.7% |
| Immigrants | Spain | 0.5 /100 | #276 | Tragic 26.6% |
| Celtics | 0.4 /100 | #277 | Tragic 26.6% |
| Immigrants | Europe | 0.4 /100 | #278 | Tragic 26.6% |
| Finns | 0.4 /100 | #279 | Tragic 26.6% |
| Senegalese | 0.4 /100 | #280 | Tragic 26.6% |
| Lithuanians | 0.3 /100 | #281 | Tragic 26.6% |
| French American Indians | 0.3 /100 | #282 | Tragic 26.6% |
| Immigrants | North America | 0.3 /100 | #283 | Tragic 26.6% |
| Immigrants | Canada | 0.3 /100 | #284 | Tragic 26.5% |
| Cambodians | 0.2 /100 | #285 | Tragic 26.5% |
| Immigrants | Senegal | 0.2 /100 | #286 | Tragic 26.5% |
| Shoshone | 0.2 /100 | #287 | Tragic 26.5% |
| Russians | 0.2 /100 | #288 | Tragic 26.5% |
| Immigrants | Sweden | 0.2 /100 | #289 | Tragic 26.5% |
| Albanians | 0.2 /100 | #290 | Tragic 26.5% |
| Bahamians | 0.2 /100 | #291 | Tragic 26.5% |
| Poles | 0.2 /100 | #292 | Tragic 26.5% |
| Blacks/African Americans | 0.1 /100 | #293 | Tragic 26.5% |