Armenian vs Immigrants from Portugal Family Households
COMPARE
Armenian
Immigrants from Portugal
Family Households
Family Households Comparison
Armenians
Immigrants from Portugal
64.4%
FAMILY HOUSEHOLDS
55.9/ 100
METRIC RATING
170th/ 347
METRIC RANK
65.2%
FAMILY HOUSEHOLDS
98.6/ 100
METRIC RATING
95th/ 347
METRIC RANK
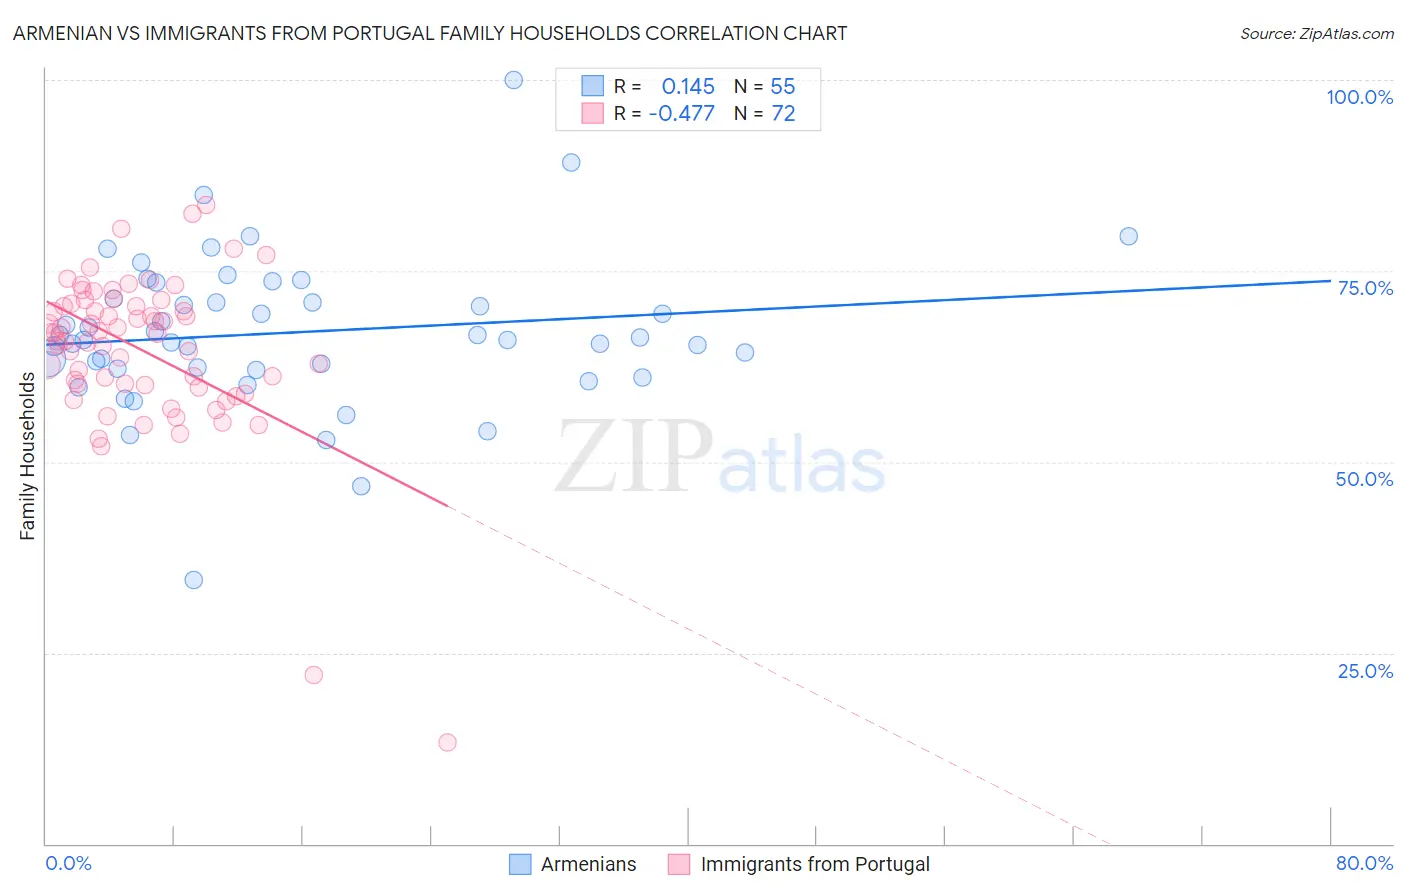
Armenian vs Immigrants from Portugal Family Households Correlation Chart
The statistical analysis conducted on geographies consisting of 310,784,197 people shows a poor positive correlation between the proportion of Armenians and percentage of family households in the United States with a correlation coefficient (R) of 0.145 and weighted average of 64.4%. Similarly, the statistical analysis conducted on geographies consisting of 174,766,633 people shows a moderate negative correlation between the proportion of Immigrants from Portugal and percentage of family households in the United States with a correlation coefficient (R) of -0.477 and weighted average of 65.2%, a difference of 1.3%.
Family Households Correlation Summary
| Measurement | Armenian | Immigrants from Portugal |
| Minimum | 34.5% | 13.2% |
| Maximum | 100.0% | 83.6% |
| Range | 65.5% | 70.4% |
| Mean | 66.9% | 64.7% |
| Median | 65.9% | 66.8% |
| Interquartile 25% (IQ1) | 62.2% | 60.1% |
| Interquartile 75% (IQ3) | 71.4% | 70.5% |
| Interquartile Range (IQR) | 9.3% | 10.4% |
| Standard Deviation (Sample) | 10.1% | 10.7% |
| Standard Deviation (Population) | 10.0% | 10.6% |
Similar Demographics by Family Households
Demographics Similar to Armenians by Family Households
In terms of family households, the demographic groups most similar to Armenians are Iraqi (64.4%, a difference of 0.0%), Honduran (64.4%, a difference of 0.020%), Ute (64.3%, a difference of 0.020%), Irish (64.4%, a difference of 0.030%), and Dutch West Indian (64.3%, a difference of 0.030%).
| Demographics | Rating | Rank | Family Households |
| Chickasaw | 61.5 /100 | #163 | Good 64.4% |
| Immigrants | Nigeria | 60.1 /100 | #164 | Good 64.4% |
| Immigrants | Southern Europe | 60.0 /100 | #165 | Good 64.4% |
| Scotch-Irish | 59.2 /100 | #166 | Average 64.4% |
| Irish | 57.9 /100 | #167 | Average 64.4% |
| Hondurans | 57.5 /100 | #168 | Average 64.4% |
| Iraqis | 56.0 /100 | #169 | Average 64.4% |
| Armenians | 55.9 /100 | #170 | Average 64.4% |
| Ute | 54.6 /100 | #171 | Average 64.3% |
| Dutch West Indians | 53.9 /100 | #172 | Average 64.3% |
| Immigrants | Sierra Leone | 52.5 /100 | #173 | Average 64.3% |
| Immigrants | Germany | 50.0 /100 | #174 | Average 64.3% |
| Bangladeshis | 44.3 /100 | #175 | Average 64.3% |
| Vietnamese | 43.6 /100 | #176 | Average 64.2% |
| Immigrants | Micronesia | 42.3 /100 | #177 | Average 64.2% |
Demographics Similar to Immigrants from Portugal by Family Households
In terms of family households, the demographic groups most similar to Immigrants from Portugal are Swiss (65.2%, a difference of 0.010%), Guatemalan (65.2%, a difference of 0.010%), Immigrants from Poland (65.2%, a difference of 0.030%), Guyanese (65.3%, a difference of 0.040%), and Hopi (65.3%, a difference of 0.050%).
| Demographics | Rating | Rank | Family Households |
| Immigrants | Haiti | 99.1 /100 | #88 | Exceptional 65.3% |
| Immigrants | Caribbean | 99.1 /100 | #89 | Exceptional 65.3% |
| Immigrants | Laos | 99.1 /100 | #90 | Exceptional 65.3% |
| Crow | 98.9 /100 | #91 | Exceptional 65.3% |
| Hopi | 98.8 /100 | #92 | Exceptional 65.3% |
| Guyanese | 98.8 /100 | #93 | Exceptional 65.3% |
| Immigrants | Poland | 98.7 /100 | #94 | Exceptional 65.2% |
| Immigrants | Portugal | 98.6 /100 | #95 | Exceptional 65.2% |
| Swiss | 98.6 /100 | #96 | Exceptional 65.2% |
| Guatemalans | 98.6 /100 | #97 | Exceptional 65.2% |
| Immigrants | Syria | 98.4 /100 | #98 | Exceptional 65.2% |
| Central American Indians | 98.3 /100 | #99 | Exceptional 65.2% |
| Haitians | 98.1 /100 | #100 | Exceptional 65.2% |
| Chileans | 98.1 /100 | #101 | Exceptional 65.2% |
| Immigrants | Sri Lanka | 98.0 /100 | #102 | Exceptional 65.1% |