American vs Laotian Single Father Households
COMPARE
American
Laotian
Single Father Households
Single Father Households Comparison
Americans
Laotians
2.4%
SINGLE FATHER HOUSEHOLDS
9.3/ 100
METRIC RATING
227th/ 347
METRIC RANK
2.2%
SINGLE FATHER HOUSEHOLDS
92.5/ 100
METRIC RATING
141st/ 347
METRIC RANK
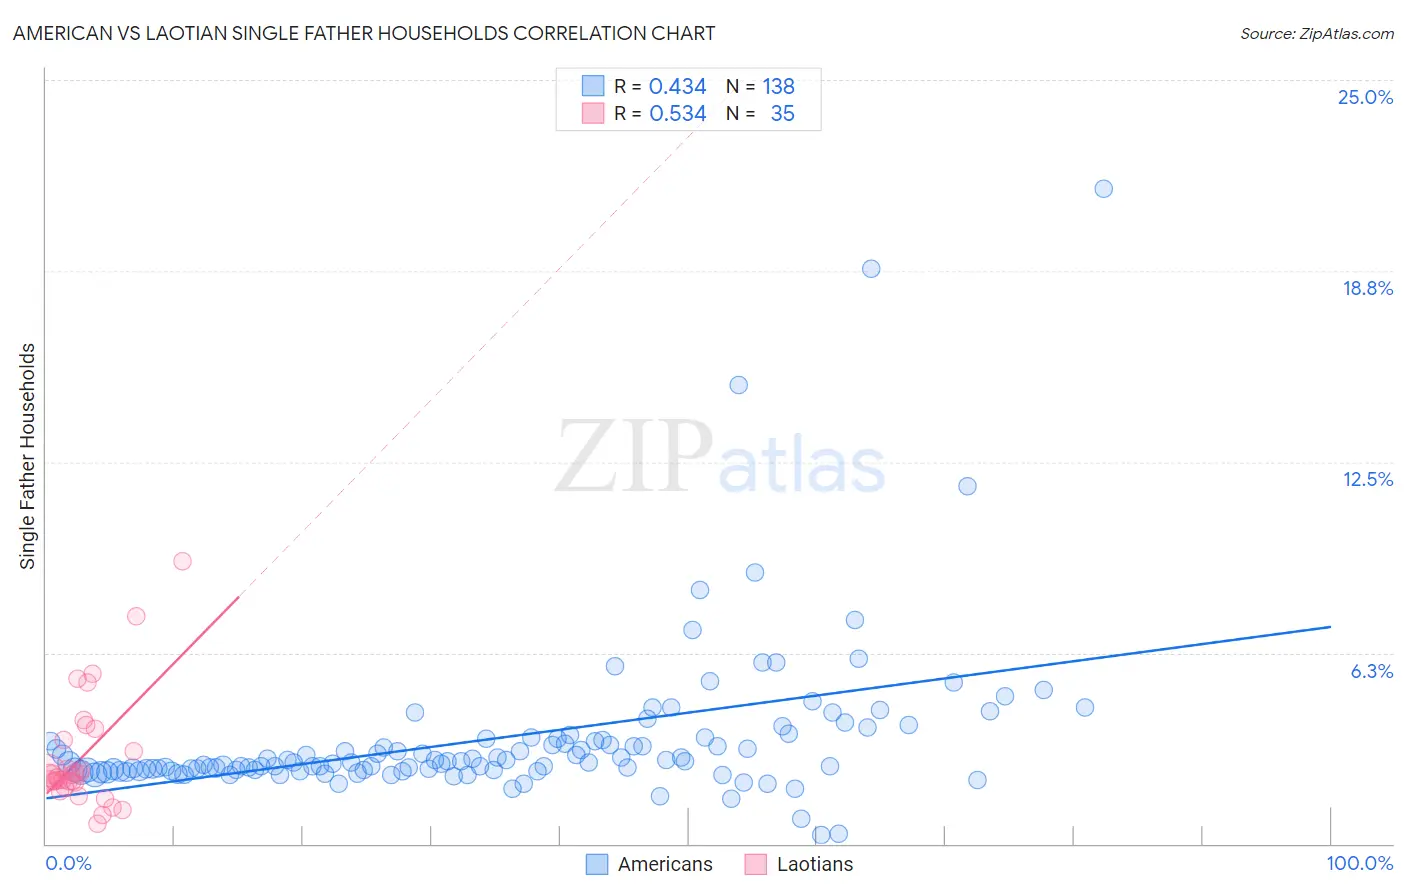
American vs Laotian Single Father Households Correlation Chart
The statistical analysis conducted on geographies consisting of 564,369,476 people shows a moderate positive correlation between the proportion of Americans and percentage of single father households in the United States with a correlation coefficient (R) of 0.434 and weighted average of 2.4%. Similarly, the statistical analysis conducted on geographies consisting of 223,877,457 people shows a substantial positive correlation between the proportion of Laotians and percentage of single father households in the United States with a correlation coefficient (R) of 0.534 and weighted average of 2.2%, a difference of 9.2%.
Single Father Households Correlation Summary
| Measurement | American | Laotian |
| Minimum | 0.29% | 0.67% |
| Maximum | 21.4% | 9.2% |
| Range | 21.1% | 8.6% |
| Mean | 3.5% | 2.8% |
| Median | 2.7% | 2.2% |
| Interquartile 25% (IQ1) | 2.4% | 2.0% |
| Interquartile 75% (IQ3) | 3.4% | 3.4% |
| Interquartile Range (IQR) | 1.0% | 1.4% |
| Standard Deviation (Sample) | 2.7% | 1.8% |
| Standard Deviation (Population) | 2.7% | 1.8% |
Similar Demographics by Single Father Households
Demographics Similar to Americans by Single Father Households
In terms of single father households, the demographic groups most similar to Americans are Immigrants from Ghana (2.4%, a difference of 0.040%), Black/African American (2.4%, a difference of 0.070%), Marshallese (2.4%, a difference of 0.080%), Immigrants from Zaire (2.4%, a difference of 0.15%), and Subsaharan African (2.4%, a difference of 0.24%).
| Demographics | Rating | Rank | Single Father Households |
| Ghanaians | 12.9 /100 | #220 | Poor 2.4% |
| Immigrants | Burma/Myanmar | 12.1 /100 | #221 | Poor 2.4% |
| Immigrants | Eastern Africa | 11.9 /100 | #222 | Poor 2.4% |
| Immigrants | Uruguay | 11.0 /100 | #223 | Poor 2.4% |
| Immigrants | Bahamas | 10.6 /100 | #224 | Poor 2.4% |
| Marshallese | 9.7 /100 | #225 | Tragic 2.4% |
| Blacks/African Americans | 9.7 /100 | #226 | Tragic 2.4% |
| Americans | 9.3 /100 | #227 | Tragic 2.4% |
| Immigrants | Ghana | 9.1 /100 | #228 | Tragic 2.4% |
| Immigrants | Zaire | 8.6 /100 | #229 | Tragic 2.4% |
| Sub-Saharan Africans | 8.3 /100 | #230 | Tragic 2.4% |
| Immigrants | Nonimmigrants | 7.6 /100 | #231 | Tragic 2.4% |
| Pennsylvania Germans | 7.3 /100 | #232 | Tragic 2.4% |
| Immigrants | Western Africa | 7.0 /100 | #233 | Tragic 2.4% |
| Africans | 6.3 /100 | #234 | Tragic 2.5% |
Demographics Similar to Laotians by Single Father Households
In terms of single father households, the demographic groups most similar to Laotians are Luxembourger (2.2%, a difference of 0.040%), Brazilian (2.2%, a difference of 0.090%), British (2.2%, a difference of 0.090%), Immigrants from Nepal (2.2%, a difference of 0.10%), and Slovak (2.2%, a difference of 0.44%).
| Demographics | Rating | Rank | Single Father Households |
| Zimbabweans | 95.1 /100 | #134 | Exceptional 2.2% |
| Syrians | 94.8 /100 | #135 | Exceptional 2.2% |
| Chileans | 94.5 /100 | #136 | Exceptional 2.2% |
| Austrians | 94.2 /100 | #137 | Exceptional 2.2% |
| West Indians | 94.1 /100 | #138 | Exceptional 2.2% |
| Brazilians | 92.8 /100 | #139 | Exceptional 2.2% |
| British | 92.8 /100 | #140 | Exceptional 2.2% |
| Laotians | 92.5 /100 | #141 | Exceptional 2.2% |
| Luxembourgers | 92.3 /100 | #142 | Exceptional 2.2% |
| Immigrants | Nepal | 92.1 /100 | #143 | Exceptional 2.2% |
| Slovaks | 90.7 /100 | #144 | Exceptional 2.2% |
| Immigrants | Zimbabwe | 90.2 /100 | #145 | Exceptional 2.2% |
| Northern Europeans | 89.8 /100 | #146 | Excellent 2.2% |
| Slavs | 88.9 /100 | #147 | Excellent 2.2% |
| South American Indians | 88.5 /100 | #148 | Excellent 2.3% |