African vs U.S. Virgin Islander Married-couple Households

COMPARE

African
Race
Ancestry
AfghanAfricanAlaska NativeAlaskan AthabascanAlbanianAleutAlsatianAmericanApacheArabArapahoArgentineanArmenianAssyrian/Chaldean/SyriacAustralianAustrianBahamianBangladeshiBarbadianBasqueBelgianBelizeanBermudanBhutaneseBlackfeetBolivianBrazilianBritishBritish West IndianBulgarianBurmeseCajunCambodianCanadianCape VerdeanCarpatho RusynCelticCentral AmericanCentral American IndianCherokeeCheyenneChickasawChileanChineseChippewaChoctawColombianColvilleComancheCosta RicanCreeCreekCroatianCrowCubanCypriotCzechCzechoslovakianDanishDelawareDominicanDutchDutch West IndianEastern EuropeanEcuadorianEgyptianEnglishEstonianEthiopianEuropeanFijianFilipinoFinnishFrenchFrench American IndianFrench CanadianGermanGerman RussianGhanaianGreekGuamanian/ChamorroGuatemalanGuyaneseHaitianHmongHonduranHopiHoumaHungarianIcelanderIndian (Asian)IndonesianInupiatIranianIraqiIrishIroquoisIsraeliItalianJamaicanJapaneseJordanianKenyanKiowaKoreanLaotianLatvianLebaneseLiberianLithuanianLumbeeLuxembourgerMacedonianMalaysianMalteseMarshalleseMenomineeMexicanMexican American IndianMongolianMoroccanNative HawaiianNavajoNepaleseNew ZealanderNicaraguanNigerianNorthern EuropeanNorwegianOkinawanOsageOttawaPaiutePakistaniPalestinianPanamanianParaguayanPennsylvania GermanPeruvianPimaPolishPortuguesePotawatomiPuebloPuerto RicanPuget Sound SalishRomanianRussianSalvadoranSamoanScandinavianScotch-IrishScottishSeminoleSenegaleseSerbianShoshoneSierra LeoneanSiouxSlavicSlovakSloveneSomaliSouth AfricanSouth AmericanSouth American IndianSoviet UnionSpaniardSpanishSpanish AmericanSpanish American IndianSri LankanSubsaharan AfricanSudaneseSwedishSwissSyrianTaiwaneseThaiTlingit-HaidaTohono O'OdhamTonganTrinidadian and TobagonianTsimshianTurkishUgandanUkrainianUruguayanUteVenezuelanVietnameseWelshWest IndianYakamaYaquiYugoslavianYumanYup'ikZimbabwean
Immigration
NonimmigrantsImmigrantsAfghanistanAfricaAlbaniaArgentinaArmeniaAsiaAustraliaAustriaBahamasBangladeshBarbadosBelarusBelgiumBelizeBoliviaBosnia and HerzegovinaBrazilBulgariaBurma/MyanmarCabo VerdeCambodiaCameroonCanadaCaribbeanCentral AmericaChileChinaColombiaCongoCosta RicaCroatiaCubaCzechoslovakiaDenmarkDominicaDominican RepublicEastern AfricaEastern AsiaEastern EuropeEcuadorEgyptEl SalvadorEnglandEritreaEthiopiaEuropeFijiFranceGermanyGhanaGreeceGrenadaGuatemalaGuyanaHaitiHondurasHong KongHungaryIndiaIndonesiaIranIraqIrelandIsraelItalyJamaicaJapanJordanKazakhstanKenyaKoreaKuwaitLaosLatin AmericaLatviaLebanonLiberiaLithuaniaMalaysiaMexicoMicronesiaMiddle AfricaMoldovaMoroccoNepalNetherlandsNicaraguaNigeriaNorth AmericaNorth MacedoniaNorthern AfricaNorthern EuropeNorwayOceaniaPakistanPanamaPeruPhilippinesPolandPortugalRomaniaRussiaSaudi ArabiaScotlandSenegalSerbiaSierra LeoneSingaporeSomaliaSouth AfricaSouth AmericaSouth Central AsiaSouth Eastern AsiaSouthern EuropeSpainSri LankaSt. Vincent and the GrenadinesSudanSwedenSwitzerlandSyriaTaiwanThailandTrinidad and TobagoTurkeyUgandaUkraineUruguayUzbekistanVenezuelaVietnamWest IndiesWestern AfricaWestern AsiaWestern EuropeYemenZaireZimbabweAzores
U.S. Virgin Islander
Race
Ancestry
AfghanAlaska NativeAlaskan AthabascanAlbanianAleutAlsatianAmericanApacheArabArapahoArgentineanArmenianAssyrian/Chaldean/SyriacAustralianAustrianBahamianBangladeshiBarbadianBasqueBelgianBelizeanBermudanBhutaneseBlackfeetBolivianBrazilianBritishBritish West IndianBulgarianBurmeseCajunCambodianCanadianCape VerdeanCarpatho RusynCelticCentral AmericanCentral American IndianCherokeeCheyenneChickasawChileanChineseChippewaChoctawColombianColvilleComancheCosta RicanCreeCreekCroatianCrowCubanCypriotCzechCzechoslovakianDanishDelawareDominicanDutchDutch West IndianEastern EuropeanEcuadorianEgyptianEnglishEstonianEthiopianEuropeanFijianFilipinoFinnishFrenchFrench American IndianFrench CanadianGermanGerman RussianGhanaianGreekGuamanian/ChamorroGuatemalanGuyaneseHaitianHmongHonduranHopiHoumaHungarianIcelanderIndian (Asian)IndonesianInupiatIranianIraqiIrishIroquoisIsraeliItalianJamaicanJapaneseJordanianKenyanKiowaKoreanLaotianLatvianLebaneseLiberianLithuanianLumbeeLuxembourgerMacedonianMalaysianMalteseMarshalleseMenomineeMexicanMexican American IndianMongolianMoroccanNative HawaiianNavajoNepaleseNew ZealanderNicaraguanNigerianNorthern EuropeanNorwegianOkinawanOsageOttawaPaiutePakistaniPalestinianPanamanianParaguayanPennsylvania GermanPeruvianPimaPolishPortuguesePotawatomiPuebloPuerto RicanPuget Sound SalishRomanianRussianSalvadoranSamoanScandinavianScotch-IrishScottishSeminoleSenegaleseSerbianShoshoneSierra LeoneanSiouxSlavicSlovakSloveneSomaliSouth AfricanSouth AmericanSouth American IndianSoviet UnionSpaniardSpanishSpanish AmericanSpanish American IndianSri LankanSubsaharan AfricanSudaneseSwedishSwissSyrianTaiwaneseThaiTlingit-HaidaTohono O'OdhamTonganTrinidadian and TobagonianTsimshianTurkishU.S. Virgin IslanderUgandanUkrainianUruguayanUteVenezuelanVietnameseWelshWest IndianYakamaYaquiYugoslavianYumanYup'ikZimbabwean
Immigration
NonimmigrantsImmigrantsAfghanistanAfricaAlbaniaArgentinaArmeniaAsiaAustraliaAustriaBahamasBangladeshBarbadosBelarusBelgiumBelizeBoliviaBosnia and HerzegovinaBrazilBulgariaBurma/MyanmarCabo VerdeCambodiaCameroonCanadaCaribbeanCentral AmericaChileChinaColombiaCongoCosta RicaCroatiaCubaCzechoslovakiaDenmarkDominicaDominican RepublicEastern AfricaEastern AsiaEastern EuropeEcuadorEgyptEl SalvadorEnglandEritreaEthiopiaEuropeFijiFranceGermanyGhanaGreeceGrenadaGuatemalaGuyanaHaitiHondurasHong KongHungaryIndiaIndonesiaIranIraqIrelandIsraelItalyJamaicaJapanJordanKazakhstanKenyaKoreaKuwaitLaosLatin AmericaLatviaLebanonLiberiaLithuaniaMalaysiaMexicoMicronesiaMiddle AfricaMoldovaMoroccoNepalNetherlandsNicaraguaNigeriaNorth AmericaNorth MacedoniaNorthern AfricaNorthern EuropeNorwayOceaniaPakistanPanamaPeruPhilippinesPolandPortugalRomaniaRussiaSaudi ArabiaScotlandSenegalSerbiaSierra LeoneSingaporeSomaliaSouth AfricaSouth AmericaSouth Central AsiaSouth Eastern AsiaSouthern EuropeSpainSri LankaSt. Vincent and the GrenadinesSudanSwedenSwitzerlandSyriaTaiwanThailandTrinidad and TobagoTurkeyUgandaUkraineUruguayUzbekistanVenezuelaVietnamWest IndiesWestern AfricaWestern AsiaWestern EuropeYemenZaireZimbabweAzores
Married-couple Households
Income
Poverty
Unemployment
Labor Participation
Family Structure
Vehicle Availability
Education Level
Disability

Married-couple Households Comparison

Africans

U.S. Virgin Islanders

Tragic
Tragic
40.9%
MARRIED-COUPLE HOUSEHOLDS
0.0/ 100
METRIC RATING
312th/ 347
METRIC RANK
39.8%
MARRIED-COUPLE HOUSEHOLDS
0.0/ 100
METRIC RATING
326th/ 347
METRIC RANK

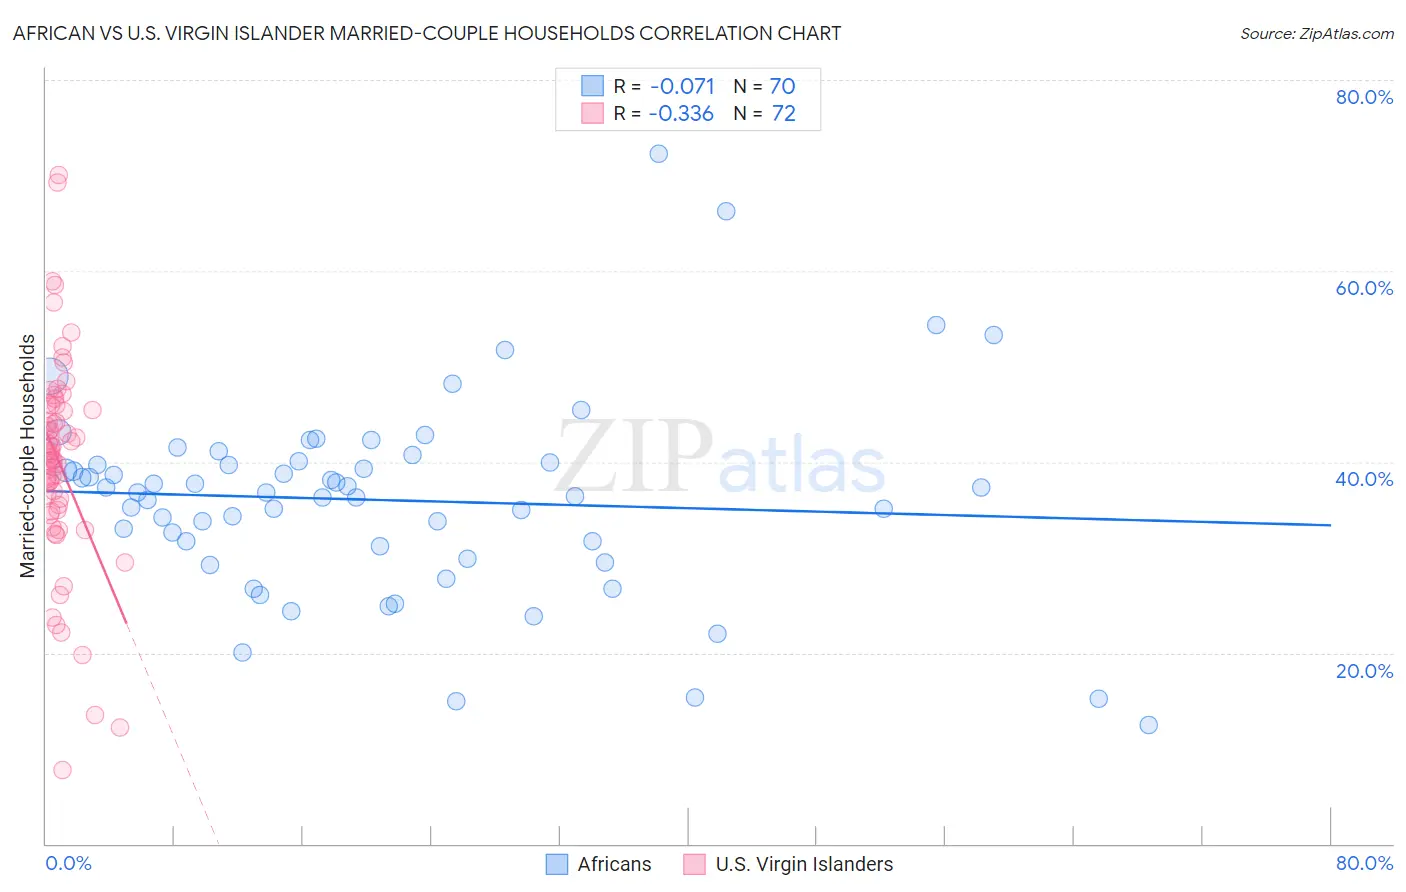
African vs U.S. Virgin Islander Married-couple Households Correlation Chart

The statistical analysis conducted on geographies consisting of 469,585,166 people shows a slight negative correlation between the proportion of Africans and percentage of married-couple family households in the United States with a correlation coefficient (R) of -0.071 and weighted average of 40.9%. Similarly, the statistical analysis conducted on geographies consisting of 87,508,365 people shows a mild negative correlation between the proportion of U.S. Virgin Islanders and percentage of married-couple family households in the United States with a correlation coefficient (R) of -0.336 and weighted average of 39.8%, a difference of 2.9%.
African vs U.S. Virgin Islander Married-couple Households

Married-couple Households Correlation Summary

MeasurementAfricanU.S. Virgin Islander
Minimum12.5%7.8%
Maximum72.3%70.0%
Range59.8%62.2%
Mean36.0%40.0%
Median36.7%40.6%
Interquartile 25% (IQ1)31.1%35.2%
Interquartile 75% (IQ3)39.9%45.7%
Interquartile Range (IQR)8.8%10.5%
Standard Deviation (Sample)10.3%11.0%
Standard Deviation (Population)10.2%10.9%

Demographics Similar to Africans and U.S. Virgin Islanders by Married-couple Households

In terms of married-couple households, the demographic groups most similar to Africans are Immigrants from Haiti (40.9%, a difference of 0.060%), Colville (41.0%, a difference of 0.090%), Jamaican (40.9%, a difference of 0.14%), Trinidadian and Tobagonian (40.9%, a difference of 0.22%), and Immigrants from Caribbean (40.8%, a difference of 0.40%). Similarly, the demographic groups most similar to U.S. Virgin Islanders are Pueblo (40.0%, a difference of 0.46%), Lumbee (39.6%, a difference of 0.47%), Navajo (40.1%, a difference of 0.69%), Immigrants from Zaire (40.1%, a difference of 0.70%), and Puerto Rican (40.1%, a difference of 0.70%).
DemographicsRating | RankMarried-couple Households
Immigrants | Trinidad and Tobago
0.0
/100
|
#309
Tragic
41.2%
Haitians
0.0
/100
|
#310
Tragic
41.2%
Colville
0.0
/100
|
#311
Tragic
41.0%
Africans
0.0
/100
|
#312
Tragic
40.9%
Immigrants | Haiti
0.0
/100
|
#313
Tragic
40.9%
Jamaicans
0.0
/100
|
#314
Tragic
40.9%
Trinidadians and Tobagonians
0.0
/100
|
#315
Tragic
40.9%
Immigrants | Caribbean
0.0
/100
|
#316
Tragic
40.8%
Immigrants | Jamaica
0.0
/100
|
#317
Tragic
40.7%
Liberians
0.0
/100
|
#318
Tragic
40.7%
Bahamians
0.0
/100
|
#319
Tragic
40.5%
West Indians
0.0
/100
|
#320
Tragic
40.3%
Immigrants | Liberia
0.0
/100
|
#321
Tragic
40.3%
Immigrants | Zaire
0.0
/100
|
#322
Tragic
40.1%
Puerto Ricans
0.0
/100
|
#323
Tragic
40.1%
Navajo
0.0
/100
|
#324
Tragic
40.1%
Pueblo
0.0
/100
|
#325
Tragic
40.0%
U.S. Virgin Islanders
0.0
/100
|
#326
Tragic
39.8%
Lumbee
0.0
/100
|
#327
Tragic
39.6%
Barbadians
0.0
/100
|
#328
Tragic
39.4%
Immigrants | Dominica
0.0
/100
|
#329
Tragic
39.4%