Afghan vs Immigrants from Central America Family Households

COMPARE

Afghan
Race
Ancestry
AfghanAfricanAlaska NativeAlaskan AthabascanAlbanianAleutAlsatianAmericanApacheArabArapahoArgentineanArmenianAssyrian/Chaldean/SyriacAustralianAustrianBahamianBangladeshiBarbadianBasqueBelgianBelizeanBermudanBhutaneseBlackfeetBolivianBrazilianBritishBritish West IndianBulgarianBurmeseCajunCambodianCanadianCape VerdeanCarpatho RusynCelticCentral AmericanCentral American IndianCherokeeCheyenneChickasawChileanChineseChippewaChoctawColombianColvilleComancheCosta RicanCreeCreekCroatianCrowCubanCypriotCzechCzechoslovakianDanishDelawareDominicanDutchDutch West IndianEastern EuropeanEcuadorianEgyptianEnglishEstonianEthiopianEuropeanFijianFilipinoFinnishFrenchFrench American IndianFrench CanadianGermanGerman RussianGhanaianGreekGuamanian/ChamorroGuatemalanGuyaneseHaitianHmongHonduranHopiHoumaHungarianIcelanderIndian (Asian)IndonesianInupiatIranianIraqiIrishIroquoisIsraeliItalianJamaicanJapaneseJordanianKenyanKiowaKoreanLaotianLatvianLebaneseLiberianLithuanianLumbeeLuxembourgerMacedonianMalaysianMalteseMarshalleseMenomineeMexicanMexican American IndianMongolianMoroccanNative HawaiianNavajoNepaleseNew ZealanderNicaraguanNigerianNorthern EuropeanNorwegianOkinawanOsageOttawaPaiutePakistaniPalestinianPanamanianParaguayanPennsylvania GermanPeruvianPimaPolishPortuguesePotawatomiPuebloPuerto RicanPuget Sound SalishRomanianRussianSalvadoranSamoanScandinavianScotch-IrishScottishSeminoleSenegaleseSerbianShoshoneSierra LeoneanSiouxSlavicSlovakSloveneSomaliSouth AfricanSouth AmericanSouth American IndianSoviet UnionSpaniardSpanishSpanish AmericanSpanish American IndianSri LankanSubsaharan AfricanSudaneseSwedishSwissSyrianTaiwaneseThaiTlingit-HaidaTohono O'OdhamTonganTrinidadian and TobagonianTsimshianTurkishU.S. Virgin IslanderUgandanUkrainianUruguayanUteVenezuelanVietnameseWelshWest IndianYakamaYaquiYugoslavianYumanYup'ikZimbabwean
Immigration
NonimmigrantsImmigrantsAfghanistanAfricaAlbaniaArgentinaArmeniaAsiaAustraliaAustriaBahamasBangladeshBarbadosBelarusBelgiumBelizeBoliviaBosnia and HerzegovinaBrazilBulgariaBurma/MyanmarCabo VerdeCambodiaCameroonCanadaCaribbeanChileChinaColombiaCongoCosta RicaCroatiaCubaCzechoslovakiaDenmarkDominicaDominican RepublicEastern AfricaEastern AsiaEastern EuropeEcuadorEgyptEl SalvadorEnglandEritreaEthiopiaEuropeFijiFranceGermanyGhanaGreeceGrenadaGuatemalaGuyanaHaitiHondurasHong KongHungaryIndiaIndonesiaIranIraqIrelandIsraelItalyJamaicaJapanJordanKazakhstanKenyaKoreaKuwaitLaosLatin AmericaLatviaLebanonLiberiaLithuaniaMalaysiaMexicoMicronesiaMiddle AfricaMoldovaMoroccoNepalNetherlandsNicaraguaNigeriaNorth AmericaNorth MacedoniaNorthern AfricaNorthern EuropeNorwayOceaniaPakistanPanamaPeruPhilippinesPolandPortugalRomaniaRussiaSaudi ArabiaScotlandSenegalSerbiaSierra LeoneSingaporeSomaliaSouth AfricaSouth AmericaSouth Central AsiaSouth Eastern AsiaSouthern EuropeSpainSri LankaSt. Vincent and the GrenadinesSudanSwedenSwitzerlandSyriaTaiwanThailandTrinidad and TobagoTurkeyUgandaUkraineUruguayUzbekistanVenezuelaVietnamWest IndiesWestern AfricaWestern AsiaWestern EuropeYemenZaireZimbabweAzores
Immigrants from Central America
Race
Ancestry
AfricanAlaska NativeAlaskan AthabascanAlbanianAleutAlsatianAmericanApacheArabArapahoArgentineanArmenianAssyrian/Chaldean/SyriacAustralianAustrianBahamianBangladeshiBarbadianBasqueBelgianBelizeanBermudanBhutaneseBlackfeetBolivianBrazilianBritishBritish West IndianBulgarianBurmeseCajunCambodianCanadianCape VerdeanCarpatho RusynCelticCentral AmericanCentral American IndianCherokeeCheyenneChickasawChileanChineseChippewaChoctawColombianColvilleComancheCosta RicanCreeCreekCroatianCrowCubanCypriotCzechCzechoslovakianDanishDelawareDominicanDutchDutch West IndianEastern EuropeanEcuadorianEgyptianEnglishEstonianEthiopianEuropeanFijianFilipinoFinnishFrenchFrench American IndianFrench CanadianGermanGerman RussianGhanaianGreekGuamanian/ChamorroGuatemalanGuyaneseHaitianHmongHonduranHopiHoumaHungarianIcelanderIndian (Asian)IndonesianInupiatIranianIraqiIrishIroquoisIsraeliItalianJamaicanJapaneseJordanianKenyanKiowaKoreanLaotianLatvianLebaneseLiberianLithuanianLumbeeLuxembourgerMacedonianMalaysianMalteseMarshalleseMenomineeMexicanMexican American IndianMongolianMoroccanNative HawaiianNavajoNepaleseNew ZealanderNicaraguanNigerianNorthern EuropeanNorwegianOkinawanOsageOttawaPaiutePakistaniPalestinianPanamanianParaguayanPennsylvania GermanPeruvianPimaPolishPortuguesePotawatomiPuebloPuerto RicanPuget Sound SalishRomanianRussianSalvadoranSamoanScandinavianScotch-IrishScottishSeminoleSenegaleseSerbianShoshoneSierra LeoneanSiouxSlavicSlovakSloveneSomaliSouth AfricanSouth AmericanSouth American IndianSoviet UnionSpaniardSpanishSpanish AmericanSpanish American IndianSri LankanSubsaharan AfricanSudaneseSwedishSwissSyrianTaiwaneseThaiTlingit-HaidaTohono O'OdhamTonganTrinidadian and TobagonianTsimshianTurkishU.S. Virgin IslanderUgandanUkrainianUruguayanUteVenezuelanVietnameseWelshWest IndianYakamaYaquiYugoslavianYumanYup'ikZimbabwean
Immigration
NonimmigrantsImmigrantsAfghanistanAfricaAlbaniaArgentinaArmeniaAsiaAustraliaAustriaBahamasBangladeshBarbadosBelarusBelgiumBelizeBoliviaBosnia and HerzegovinaBrazilBulgariaBurma/MyanmarCabo VerdeCambodiaCameroonCanadaCaribbeanCentral AmericaChileChinaColombiaCongoCosta RicaCroatiaCubaCzechoslovakiaDenmarkDominicaDominican RepublicEastern AfricaEastern AsiaEastern EuropeEcuadorEgyptEl SalvadorEnglandEritreaEthiopiaEuropeFijiFranceGermanyGhanaGreeceGrenadaGuatemalaGuyanaHaitiHondurasHong KongHungaryIndiaIndonesiaIranIraqIrelandIsraelItalyJamaicaJapanJordanKazakhstanKenyaKoreaKuwaitLaosLatin AmericaLatviaLebanonLiberiaLithuaniaMalaysiaMexicoMicronesiaMiddle AfricaMoldovaMoroccoNepalNetherlandsNicaraguaNigeriaNorth AmericaNorth MacedoniaNorthern AfricaNorthern EuropeNorwayOceaniaPakistanPanamaPeruPhilippinesPolandPortugalRomaniaRussiaSaudi ArabiaScotlandSenegalSerbiaSierra LeoneSingaporeSomaliaSouth AfricaSouth AmericaSouth Central AsiaSouth Eastern AsiaSouthern EuropeSpainSri LankaSt. Vincent and the GrenadinesSudanSwedenSwitzerlandSyriaTaiwanThailandTrinidad and TobagoTurkeyUgandaUkraineUruguayUzbekistanVenezuelaVietnamWest IndiesWestern AfricaWestern AsiaWestern EuropeYemenZaireZimbabweAzores
Family Households
Income
Poverty
Unemployment
Labor Participation
Family Structure
Vehicle Availability
Education Level
Disability

Family Households Comparison

Afghans

Immigrants from Central America

Exceptional
Exceptional
66.3%
FAMILY HOUSEHOLDS
100.0/ 100
METRIC RATING
53rd/ 347
METRIC RANK
68.3%
FAMILY HOUSEHOLDS
100.0/ 100
METRIC RATING
11th/ 347
METRIC RANK

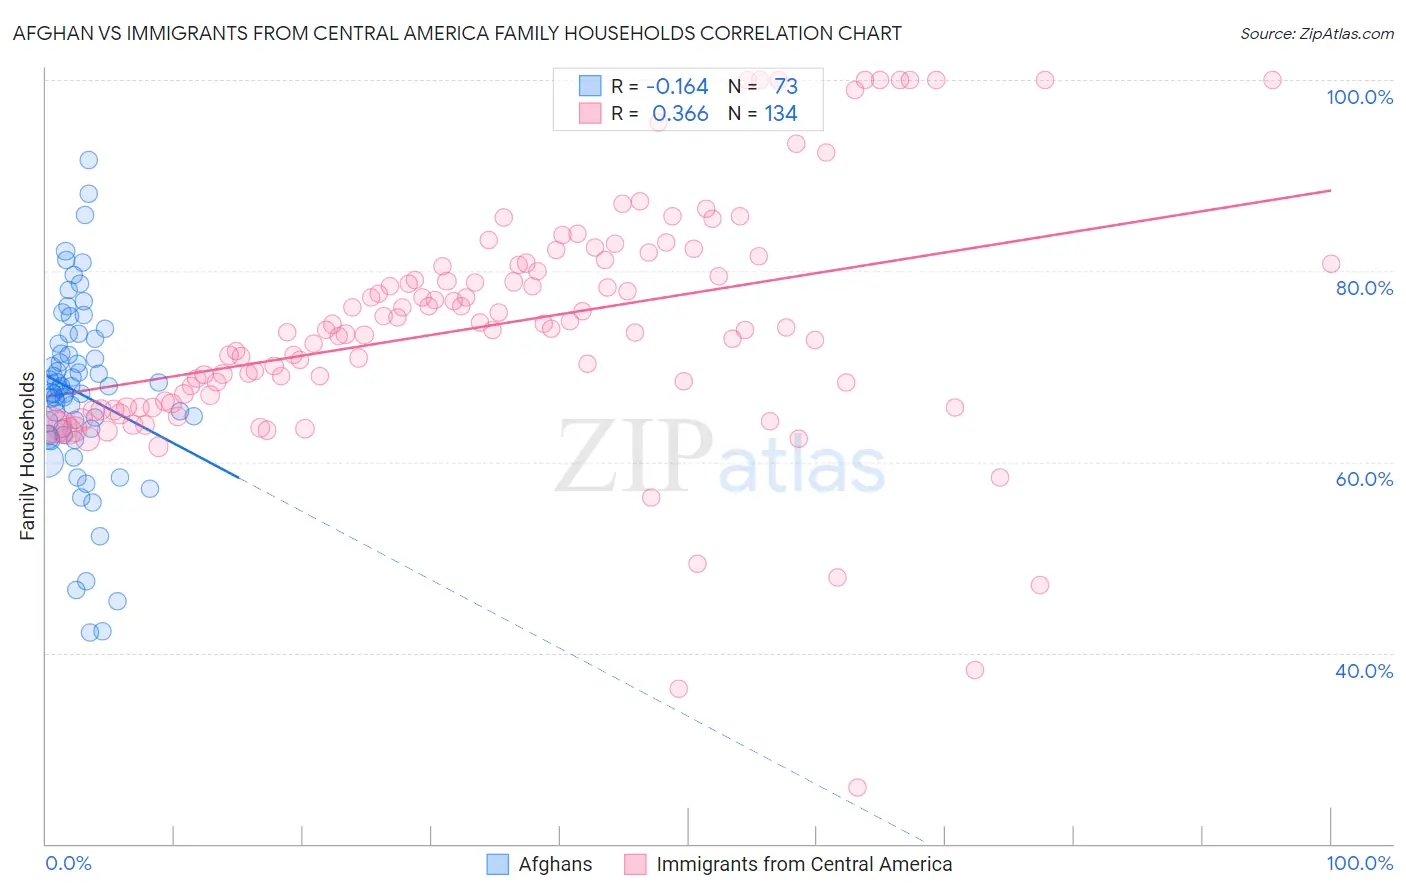
Afghan vs Immigrants from Central America Family Households Correlation Chart

The statistical analysis conducted on geographies consisting of 148,833,722 people shows a poor negative correlation between the proportion of Afghans and percentage of family households in the United States with a correlation coefficient (R) of -0.164 and weighted average of 66.3%. Similarly, the statistical analysis conducted on geographies consisting of 536,086,114 people shows a mild positive correlation between the proportion of Immigrants from Central America and percentage of family households in the United States with a correlation coefficient (R) of 0.366 and weighted average of 68.3%, a difference of 3.1%.
Afghan vs Immigrants from Central America Family Households

Family Households Correlation Summary

MeasurementAfghanImmigrants from Central America
Minimum42.2%25.8%
Maximum91.7%100.0%
Range49.5%74.2%
Mean67.2%74.3%
Median67.7%73.9%
Interquartile 25% (IQ1)62.8%66.1%
Interquartile 75% (IQ3)72.6%80.8%
Interquartile Range (IQR)9.8%14.7%
Standard Deviation (Sample)9.6%12.7%
Standard Deviation (Population)9.6%12.7%

Similar Demographics by Family Households

Demographics Similar to Afghans by Family Households

In terms of family households, the demographic groups most similar to Afghans are Immigrants from Colombia (66.3%, a difference of 0.0%), Colombian (66.3%, a difference of 0.010%), Native/Alaskan (66.4%, a difference of 0.14%), Navajo (66.4%, a difference of 0.17%), and Immigrants (66.1%, a difference of 0.17%).
DemographicsRating | RankFamily Households
Arapaho
100.0
/100
|
#46
Exceptional
66.5%
Bolivians
100.0
/100
|
#47
Exceptional
66.5%
Immigrants | Venezuela
100.0
/100
|
#48
Exceptional
66.4%
Immigrants | South Central Asia
100.0
/100
|
#49
Exceptional
66.4%
Navajo
100.0
/100
|
#50
Exceptional
66.4%
Natives/Alaskans
100.0
/100
|
#51
Exceptional
66.4%
Colombians
100.0
/100
|
#52
Exceptional
66.3%
Afghans
100.0
/100
|
#53
Exceptional
66.3%
Immigrants | Colombia
100.0
/100
|
#54
Exceptional
66.3%
Immigrants | Immigrants
100.0
/100
|
#55
Exceptional
66.1%
Immigrants | Hong Kong
100.0
/100
|
#56
Exceptional
66.1%
Pennsylvania Germans
100.0
/100
|
#57
Exceptional
66.1%
Immigrants | Asia
100.0
/100
|
#58
Exceptional
66.1%
Immigrants | Korea
100.0
/100
|
#59
Exceptional
66.0%
South Americans
100.0
/100
|
#60
Exceptional
66.0%

Demographics Similar to Immigrants from Central America by Family Households

In terms of family households, the demographic groups most similar to Immigrants from Central America are Korean (68.3%, a difference of 0.030%), Immigrants from Philippines (68.3%, a difference of 0.070%), Pueblo (68.2%, a difference of 0.11%), Immigrants from Cuba (68.2%, a difference of 0.12%), and Native Hawaiian (68.4%, a difference of 0.14%).
DemographicsRating | RankFamily Households
Yakama
100.0
/100
|
#4
Exceptional
69.3%
Yuman
100.0
/100
|
#5
Exceptional
69.3%
Immigrants | Mexico
100.0
/100
|
#6
Exceptional
69.1%
Mexicans
100.0
/100
|
#7
Exceptional
69.0%
Immigrants | Fiji
100.0
/100
|
#8
Exceptional
68.8%
Native Hawaiians
100.0
/100
|
#9
Exceptional
68.4%
Immigrants | Philippines
100.0
/100
|
#10
Exceptional
68.3%
Immigrants | Central America
100.0
/100
|
#11
Exceptional
68.3%
Koreans
100.0
/100
|
#12
Exceptional
68.3%
Pueblo
100.0
/100
|
#13
Exceptional
68.2%
Immigrants | Cuba
100.0
/100
|
#14
Exceptional
68.2%
Assyrians/Chaldeans/Syriacs
100.0
/100
|
#15
Exceptional
68.2%
Immigrants | Vietnam
100.0
/100
|
#16
Exceptional
68.2%
Chinese
100.0
/100
|
#17
Exceptional
68.1%
Immigrants | Taiwan
100.0
/100
|
#18
Exceptional
68.0%