Yaqui vs Tongan Kindergarten
COMPARE
Yaqui
Tongan
Kindergarten
Kindergarten Comparison
Yaqui
Tongans
97.6%
KINDERGARTEN
0.7/ 100
METRIC RATING
256th/ 347
METRIC RANK
97.7%
KINDERGARTEN
4.8/ 100
METRIC RATING
220th/ 347
METRIC RANK
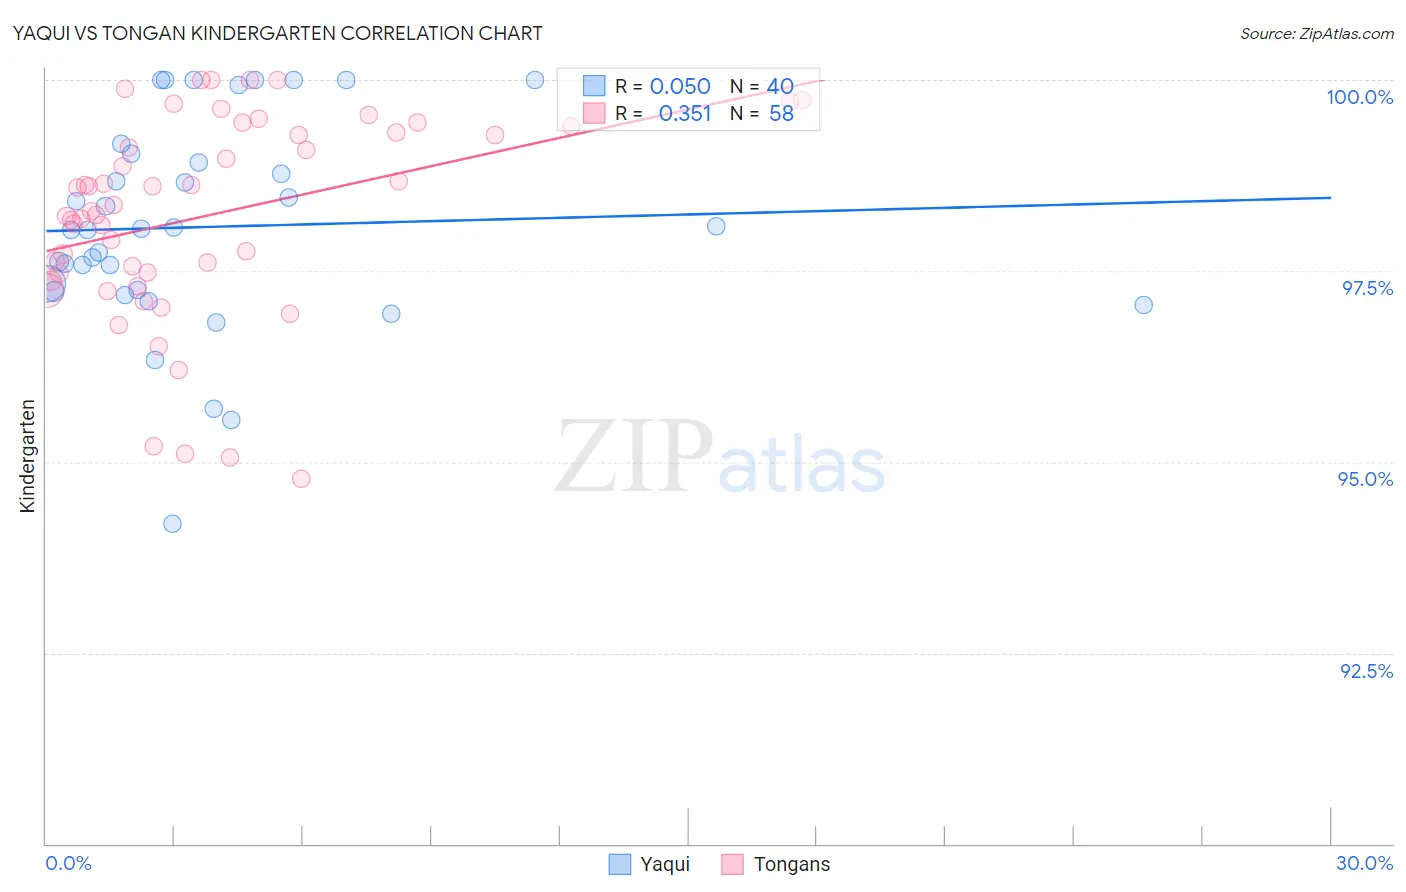
Yaqui vs Tongan Kindergarten Correlation Chart
The statistical analysis conducted on geographies consisting of 107,732,380 people shows no correlation between the proportion of Yaqui and percentage of population with at least kindergarten education in the United States with a correlation coefficient (R) of 0.050 and weighted average of 97.6%. Similarly, the statistical analysis conducted on geographies consisting of 102,908,759 people shows a mild positive correlation between the proportion of Tongans and percentage of population with at least kindergarten education in the United States with a correlation coefficient (R) of 0.351 and weighted average of 97.7%, a difference of 0.15%.
Kindergarten Correlation Summary
| Measurement | Yaqui | Tongan |
| Minimum | 94.2% | 94.8% |
| Maximum | 100.0% | 100.0% |
| Range | 5.8% | 5.2% |
| Mean | 98.1% | 98.2% |
| Median | 98.0% | 98.3% |
| Interquartile 25% (IQ1) | 97.2% | 97.5% |
| Interquartile 75% (IQ3) | 99.0% | 99.3% |
| Interquartile Range (IQR) | 1.7% | 1.8% |
| Standard Deviation (Sample) | 1.4% | 1.3% |
| Standard Deviation (Population) | 1.3% | 1.3% |
Similar Demographics by Kindergarten
Demographics Similar to Yaqui by Kindergarten
In terms of kindergarten, the demographic groups most similar to Yaqui are Immigrants from Asia (97.6%, a difference of 0.0%), Immigrants from Congo (97.6%, a difference of 0.0%), Immigrants from Iraq (97.6%, a difference of 0.010%), Immigrants from Africa (97.6%, a difference of 0.010%), and Immigrants from Colombia (97.6%, a difference of 0.010%).
| Demographics | Rating | Rank | Kindergarten |
| Peruvians | 1.0 /100 | #249 | Tragic 97.6% |
| Immigrants | Senegal | 0.9 /100 | #250 | Tragic 97.6% |
| Ethiopians | 0.9 /100 | #251 | Tragic 97.6% |
| Immigrants | Iraq | 0.9 /100 | #252 | Tragic 97.6% |
| Immigrants | Africa | 0.8 /100 | #253 | Tragic 97.6% |
| Immigrants | Asia | 0.8 /100 | #254 | Tragic 97.6% |
| Immigrants | Congo | 0.8 /100 | #255 | Tragic 97.6% |
| Yaqui | 0.7 /100 | #256 | Tragic 97.6% |
| Immigrants | Colombia | 0.6 /100 | #257 | Tragic 97.6% |
| Jamaicans | 0.6 /100 | #258 | Tragic 97.6% |
| Armenians | 0.5 /100 | #259 | Tragic 97.6% |
| Fijians | 0.5 /100 | #260 | Tragic 97.5% |
| Taiwanese | 0.4 /100 | #261 | Tragic 97.5% |
| Immigrants | Ethiopia | 0.4 /100 | #262 | Tragic 97.5% |
| Immigrants | South America | 0.4 /100 | #263 | Tragic 97.5% |
Demographics Similar to Tongans by Kindergarten
In terms of kindergarten, the demographic groups most similar to Tongans are Immigrants from Panama (97.7%, a difference of 0.0%), Immigrants from Zaire (97.7%, a difference of 0.0%), Immigrants from Sudan (97.7%, a difference of 0.0%), Immigrants from Morocco (97.7%, a difference of 0.010%), and Immigrants from Syria (97.7%, a difference of 0.010%).
| Demographics | Rating | Rank | Kindergarten |
| South American Indians | 7.7 /100 | #213 | Tragic 97.8% |
| Uruguayans | 7.5 /100 | #214 | Tragic 97.8% |
| Immigrants | Bahamas | 7.4 /100 | #215 | Tragic 97.8% |
| Samoans | 6.9 /100 | #216 | Tragic 97.8% |
| Bahamians | 6.6 /100 | #217 | Tragic 97.8% |
| Immigrants | Morocco | 5.4 /100 | #218 | Tragic 97.7% |
| Immigrants | Panama | 5.0 /100 | #219 | Tragic 97.7% |
| Tongans | 4.8 /100 | #220 | Tragic 97.7% |
| Immigrants | Zaire | 4.5 /100 | #221 | Tragic 97.7% |
| Immigrants | Sudan | 4.5 /100 | #222 | Tragic 97.7% |
| Immigrants | Syria | 4.3 /100 | #223 | Tragic 97.7% |
| Iraqis | 3.9 /100 | #224 | Tragic 97.7% |
| Immigrants | Nepal | 3.8 /100 | #225 | Tragic 97.7% |
| Sudanese | 3.7 /100 | #226 | Tragic 97.7% |
| Immigrants | Costa Rica | 3.6 /100 | #227 | Tragic 97.7% |