Yaqui vs Nonimmigrants Kindergarten
COMPARE
Yaqui
Nonimmigrants
Kindergarten
Kindergarten Comparison
Yaqui
Nonimmigrants
97.6%
KINDERGARTEN
0.7/ 100
METRIC RATING
256th/ 347
METRIC RANK
98.3%
KINDERGARTEN
98.3/ 100
METRIC RATING
96th/ 347
METRIC RANK
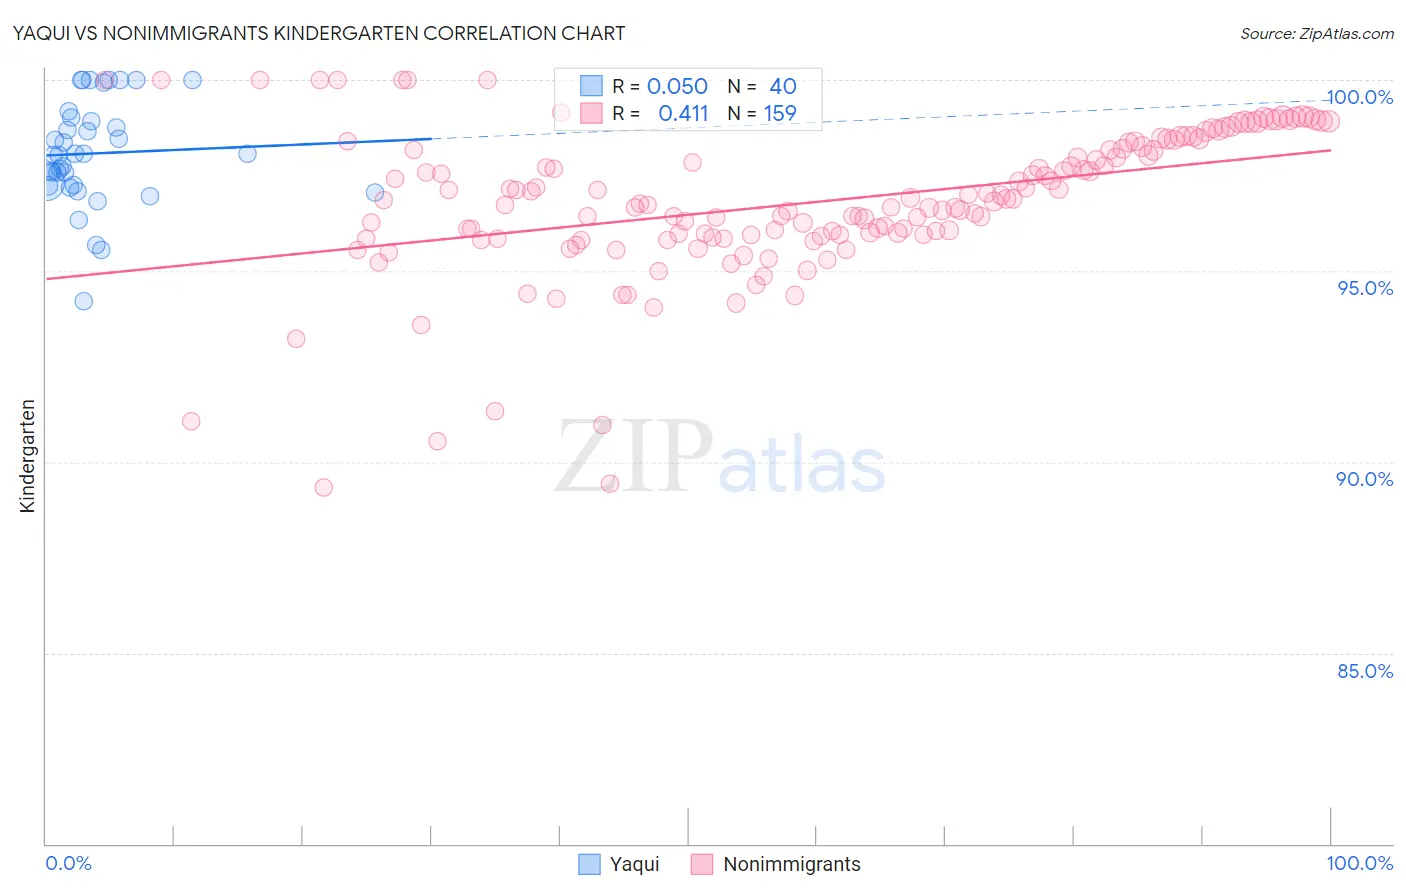
Yaqui vs Nonimmigrants Kindergarten Correlation Chart
The statistical analysis conducted on geographies consisting of 107,732,380 people shows no correlation between the proportion of Yaqui and percentage of population with at least kindergarten education in the United States with a correlation coefficient (R) of 0.050 and weighted average of 97.6%. Similarly, the statistical analysis conducted on geographies consisting of 585,374,774 people shows a moderate positive correlation between the proportion of Nonimmigrants and percentage of population with at least kindergarten education in the United States with a correlation coefficient (R) of 0.411 and weighted average of 98.3%, a difference of 0.69%.
Kindergarten Correlation Summary
| Measurement | Yaqui | Nonimmigrants |
| Minimum | 94.2% | 89.3% |
| Maximum | 100.0% | 100.0% |
| Range | 5.8% | 10.7% |
| Mean | 98.1% | 96.8% |
| Median | 98.0% | 96.8% |
| Interquartile 25% (IQ1) | 97.2% | 95.9% |
| Interquartile 75% (IQ3) | 99.0% | 98.3% |
| Interquartile Range (IQR) | 1.7% | 2.4% |
| Standard Deviation (Sample) | 1.4% | 1.9% |
| Standard Deviation (Population) | 1.3% | 1.9% |
Similar Demographics by Kindergarten
Demographics Similar to Yaqui by Kindergarten
In terms of kindergarten, the demographic groups most similar to Yaqui are Immigrants from Asia (97.6%, a difference of 0.0%), Immigrants from Congo (97.6%, a difference of 0.0%), Immigrants from Iraq (97.6%, a difference of 0.010%), Immigrants from Africa (97.6%, a difference of 0.010%), and Immigrants from Colombia (97.6%, a difference of 0.010%).
| Demographics | Rating | Rank | Kindergarten |
| Peruvians | 1.0 /100 | #249 | Tragic 97.6% |
| Immigrants | Senegal | 0.9 /100 | #250 | Tragic 97.6% |
| Ethiopians | 0.9 /100 | #251 | Tragic 97.6% |
| Immigrants | Iraq | 0.9 /100 | #252 | Tragic 97.6% |
| Immigrants | Africa | 0.8 /100 | #253 | Tragic 97.6% |
| Immigrants | Asia | 0.8 /100 | #254 | Tragic 97.6% |
| Immigrants | Congo | 0.8 /100 | #255 | Tragic 97.6% |
| Yaqui | 0.7 /100 | #256 | Tragic 97.6% |
| Immigrants | Colombia | 0.6 /100 | #257 | Tragic 97.6% |
| Jamaicans | 0.6 /100 | #258 | Tragic 97.6% |
| Armenians | 0.5 /100 | #259 | Tragic 97.6% |
| Fijians | 0.5 /100 | #260 | Tragic 97.5% |
| Taiwanese | 0.4 /100 | #261 | Tragic 97.5% |
| Immigrants | Ethiopia | 0.4 /100 | #262 | Tragic 97.5% |
| Immigrants | South America | 0.4 /100 | #263 | Tragic 97.5% |
Demographics Similar to Nonimmigrants by Kindergarten
In terms of kindergarten, the demographic groups most similar to Nonimmigrants are Cypriot (98.3%, a difference of 0.0%), Choctaw (98.3%, a difference of 0.0%), Colville (98.3%, a difference of 0.0%), South African (98.3%, a difference of 0.010%), and Immigrants from Germany (98.3%, a difference of 0.010%).
| Demographics | Rating | Rank | Kindergarten |
| Immigrants | South Africa | 98.8 /100 | #89 | Exceptional 98.3% |
| Zimbabweans | 98.8 /100 | #90 | Exceptional 98.3% |
| Immigrants | Western Europe | 98.8 /100 | #91 | Exceptional 98.3% |
| Macedonians | 98.7 /100 | #92 | Exceptional 98.3% |
| Immigrants | India | 98.6 /100 | #93 | Exceptional 98.3% |
| South Africans | 98.5 /100 | #94 | Exceptional 98.3% |
| Immigrants | Germany | 98.5 /100 | #95 | Exceptional 98.3% |
| Immigrants | Nonimmigrants | 98.3 /100 | #96 | Exceptional 98.3% |
| Cypriots | 98.3 /100 | #97 | Exceptional 98.3% |
| Choctaw | 98.2 /100 | #98 | Exceptional 98.3% |
| Colville | 98.2 /100 | #99 | Exceptional 98.3% |
| Puget Sound Salish | 98.1 /100 | #100 | Exceptional 98.2% |
| Romanians | 97.8 /100 | #101 | Exceptional 98.2% |
| Cree | 97.7 /100 | #102 | Exceptional 98.2% |
| Immigrants | Ireland | 97.6 /100 | #103 | Exceptional 98.2% |